Infographic Slide - Smartwatch Design
RJ0400043_11
- Last Update 05/28/2025
- File Size 1.5MB
- # of Slides 2
- File Format PPTX
- Slide Ratio 16:9
- Color
Keywords
- #Content-Based Slides
- #Design-Based Slides
- #Business Introduction
- #Market and Competitor Analysis
- #Graph
- #Technological Status
- #Customer Analysis
- #Other
- #Other Charts
- #16:9
- #smartwatch infographic PowerPoint slide
- #product presentation template
- #wearable device mockup
- #technology infographic PPT
- #visual chart slide design
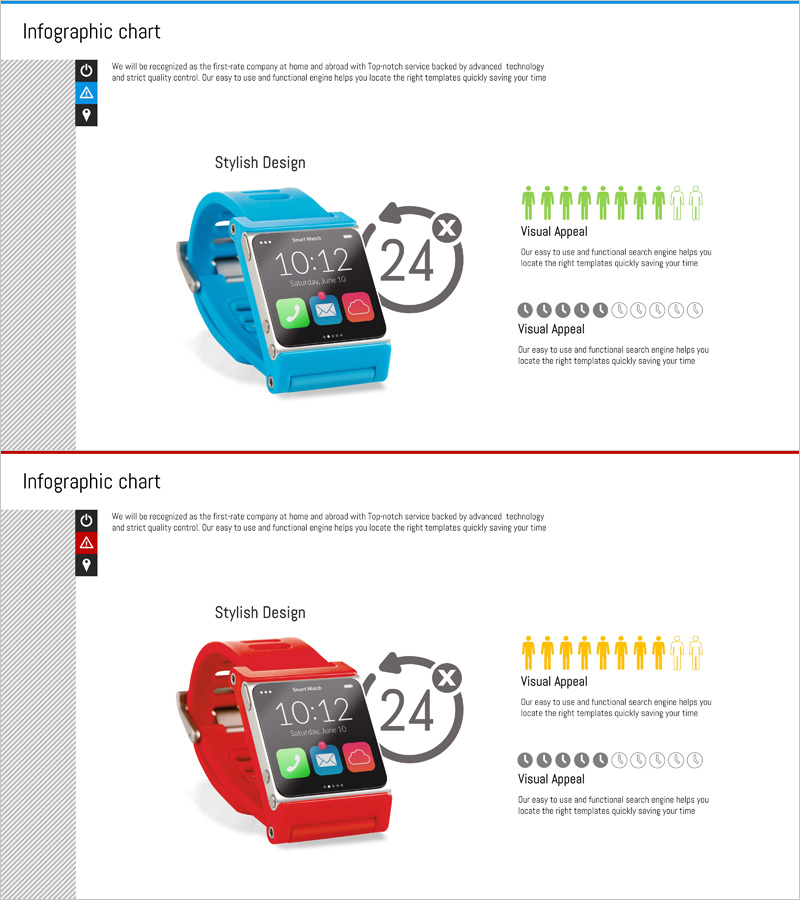
About the Product
An infographic PowerPoint slide set showcasing smartwatch product features and technical specifications with visual impact. Includes two color versions—blue and red—featuring smartwatch device mockups, 24-hour timer icons, user silhouette graphs, and star rating systems. Perfect for product launch presentations, technology marketing decks, and product catalogs. The 16:9 widescreen format includes 2 fully editable slides where you can customize text, images, and color schemes to match your brand identity.
Usage Points
-
Main Usage
Communicate smartwatch and wearable device features, usage duration, and user satisfaction ratings through compelling visual infographics. Ideal for product launch presentations, technology marketing decks, investor pitches, and product catalogs where clear feature communication is essential.
-
How to Use
Utilize the smartwatch mockup images, 24-hour timer dial, user silhouette graphs, and star rating systems to highlight key product features. Replace placeholder text with product specifications, user testimonials, and technical details. Adjust colors to align with your brand guidelines and use as your presentation slide.
-
Recommended For
Product marketing managers, technology companies, startup founders, sales teams, product development teams, and business professionals presenting wearable devices, smart accessories, or IoT products. Suitable for corporate presentations, investor meetings, and promotional materials.
-
Slide Structure
Two-slide set with smartwatch mockups (blue and red versions), 24-hour timer dial graphic, user silhouette graphs (10 figures with fill/unfill states), and star rating systems (10 stars with fill/unfill states). Left sidebar with info/warning/location icons, center product mockup, right-side text area and data visualization in three-column layout.
Related Products
-

User Analysis Pictogram Graph – Visualizing Customer Success
#Market and Competitor Analysis #Customer Success Stories #Graph
-

Gender Ratio Analysis Graph Chart – Data Visualization and Customer Insights
#Market and Competitor Analysis #Graph #Other
-

Premium Management Presentation Map Analysis3 - Customer Insights and Market Analysis
#Market and Competitor Analysis #Graph #Other
-

Global User Status Analysis Graph – Data Visualization
#Market and Competitor Analysis #Graph #Other
