Fashion Business Profit and Loss Table - Financial Performance and Strategy
RJ0800045_12
- Last Update 08/12/2025
- File Size 13.3MB
- # of Slides 2
- File Format PPTX
- Slide Ratio 16:9
- Color
Keywords
- #Content-Based Slides
- #Design-Based Slides
- #Financial Plans and Performance
- #Diagram
- #Income Statement
- #Key Financial Indicators
- #Table
- #Standard Table
- #16:9
- #fashion business profit and loss table
- #financial performance table PowerPoint
- #income statement slide template
- #revenue cost comparison chart
- #fashion industry financial analysis
About the Product
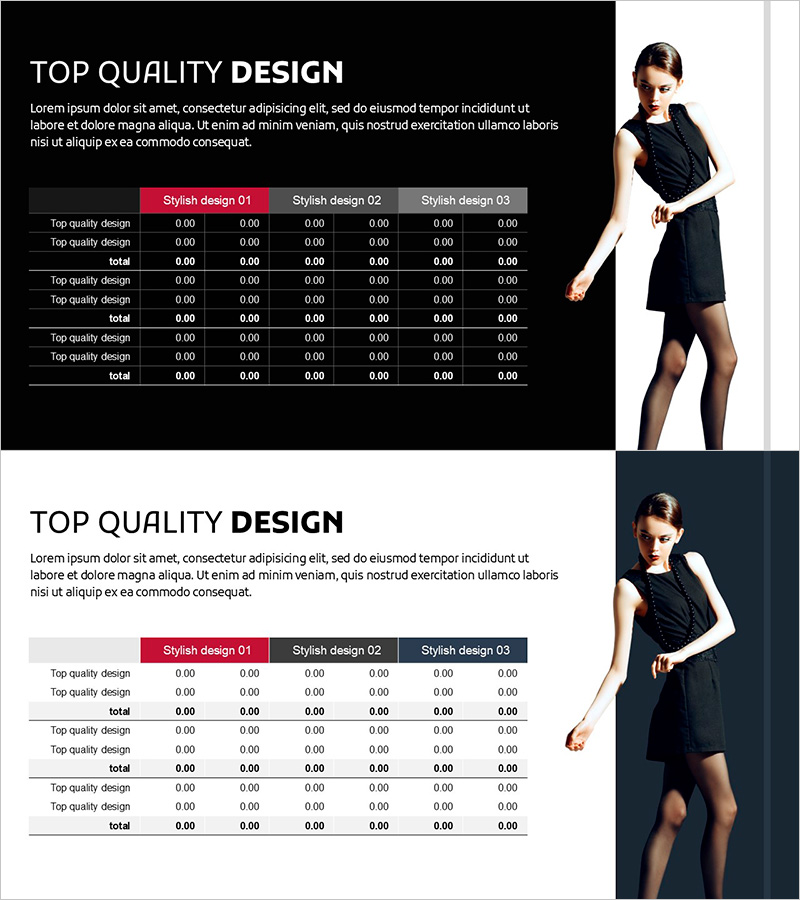
A professional profit and loss analysis table PowerPoint slide designed for fashion business financial performance visualization. Built on a black background with white typography and red header accents, this slide deck offers three stylish design options (Stylish design 01, 02, and 03). The table structure features six columns and multiple rows to compare key financial metrics including revenue, cost of goods sold, gross profit, operating expenses, net income, and profit margin. Ideal for quarterly earnings presentations, product line profitability analysis, and strategic financial decision-making in fashion retail and manufacturing companies.
Usage Points
-
Main Usage
This profit and loss analysis table enables fashion companies to quantitatively assess financial performance and support strategic decision-making. The six-column structure compares revenue, cost of goods sold, gross profit, operating expenses, net income, and profit margin across product lines, seasons, or distribution channels. The black background with red header accents emphasizes critical financial information, facilitating clear communication with investors, executives, and team members during financial reviews.
-
How to Use
Deploy this slide in executive board meetings, quarterly earnings presentations, investor pitch decks, and internal strategy sessions to explain financial status. Input actual figures into each cell to analyze profitability by product category, geographic region, or sales channel, then use the insights to develop revenue optimization strategies. Select from three design style options to match your presentation theme and maintain visual consistency throughout your financial report.
-
Recommended For
Recommended for CFOs, finance managers, business unit directors, and marketing leaders in fashion and apparel companies presenting quarterly or annual performance results. Also suitable for fashion startups seeking investment funding, fashion consulting firms delivering client analysis reports, and fashion retail companies conducting internal management reviews. Applicable to any business presentation requiring clear financial data visualization and comparative analysis.
-
Slide Structure
Two-slide deck featuring a six-column table structure (Stylish design 01, 02, 03 plus four data columns) with eight to ten rows for categories and data entries. The first slide combines a black background with a professional female model image and the financial table positioned on the right. The second slide uses a dark navy background with the table centered for alternative presentation layouts. All cells are fully editable, with the header row highlighted in red for visual distinction and emphasis.
Related Products
-

Illustration Theme Income Statement Table – Visualization of Financial Performance
#Financial Plans and Performance #Diagram #Income Statement
-

Key Financial Indicators Table – Trust and Professionalism
#Financial Plans and Performance #Diagram #Income Statement
-

Income Statement Table – Clearly Presenting Financial Plans and Performance
#Financial Plans and Performance #Diagram #Income Statement
-

Income Statement Table – Clearly Presenting Financial Plans and Performance
#Financial Plans and Performance #Diagram #Income Statement
