Income Statement Table for Visualizing Financial Performance - Insights Navigator
RJ0300060_25
- Last Update 05/04/2025
- File Size 0.1MB
- # of Slides 2
- File Format PPTX
- Slide Ratio 16:9
- Color
Keywords
- #Content-Based Slides
- #Design-Based Slides
- #Financial Plans and Performance
- #Diagram
- #Income Statement
- #Key Financial Indicators
- #Table
- #Standard Table
- #16:9
- #financial table PowerPoint
- #income statement slide template
- #financial data visualization
- #financial metrics presentation
- #business report table slide
About the Product
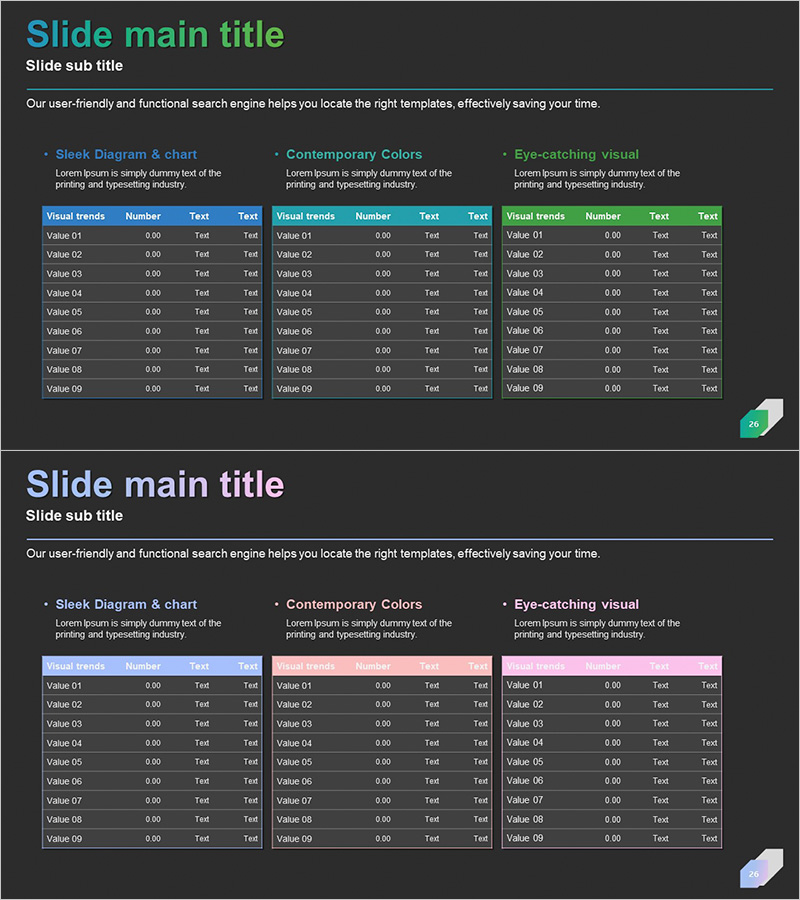
A professional financial data table PowerPoint slide featuring a 9-row structure for presenting income statements and financial performance metrics. The dark gray background with teal, pink, and green section headers creates three distinct data tables, each with Value, Number, and Text columns for organizing financial figures, ratios, and performance indicators. This presentation template is ready to use for quarterly reports, investor presentations, and financial analysis decks.
Usage Points
-
Main Usage
Organize and compare financial data, performance indicators, and income statement figures in a structured table format. Ideal for presenting quarterly results, financial ratios, and budget analysis to stakeholders and decision-makers.
-
How to Use
Input financial figures and line items into the Value, Number, and Text columns of each table. Use the teal, pink, and green headers to distinguish between different financial categories or reporting periods. Perfect for investor meetings, board presentations, and financial analysis slides.
-
Recommended For
CFOs, financial analysts, investment relations professionals, and executives presenting financial performance. Suitable for business plans, quarterly earnings reports, investor pitch decks, financial dashboards, and performance analysis presentations.
-
Slide Structure
Two-slide set featuring three data tables per slide with color-coded headers (teal, pink, green). Each table contains 9 rows (Value 01–09) and 4 columns (Visual trends, Number, Text, Text). Optimized for 16:9 widescreen format with dark gray background.
Related Products
-

Illustration Theme Income Statement Table – Visualization of Financial Performance
#Financial Plans and Performance #Diagram #Income Statement
-

Paper Theme Key Financial Indicators Slide
#Financial Plans and Performance #Diagram #Income Statement
-

Income Statement Table – Clearly Presenting Financial Plans and Performance
#Financial Plans and Performance #Diagram #Income Statement
-

Key Financial Indicators Table – Essential Information Visualization
#Financial Plans and Performance #Diagram #Income Statement
