Income Statement Table – Clearly Presenting Financial Plans and Performance
RJ0300037_7
- Last Update 04/28/2025
- File Size 1.1MB
- # of Slides 2
- File Format PPTX
- Slide Ratio 16:9
- Color
Keywords
- #Content-Based Slides
- #Design-Based Slides
- #Financial Plans and Performance
- #Diagram
- #Income Statement
- #Key Financial Indicators
- #Cluster
- #Table
- #Closed Cluster Diagram
- #Standard Table
- #16:9
- #income statement table PowerPoint
- #financial data table presentation
- #table slide template
- #financial planning presentation
- #income statement slide design
About the Product
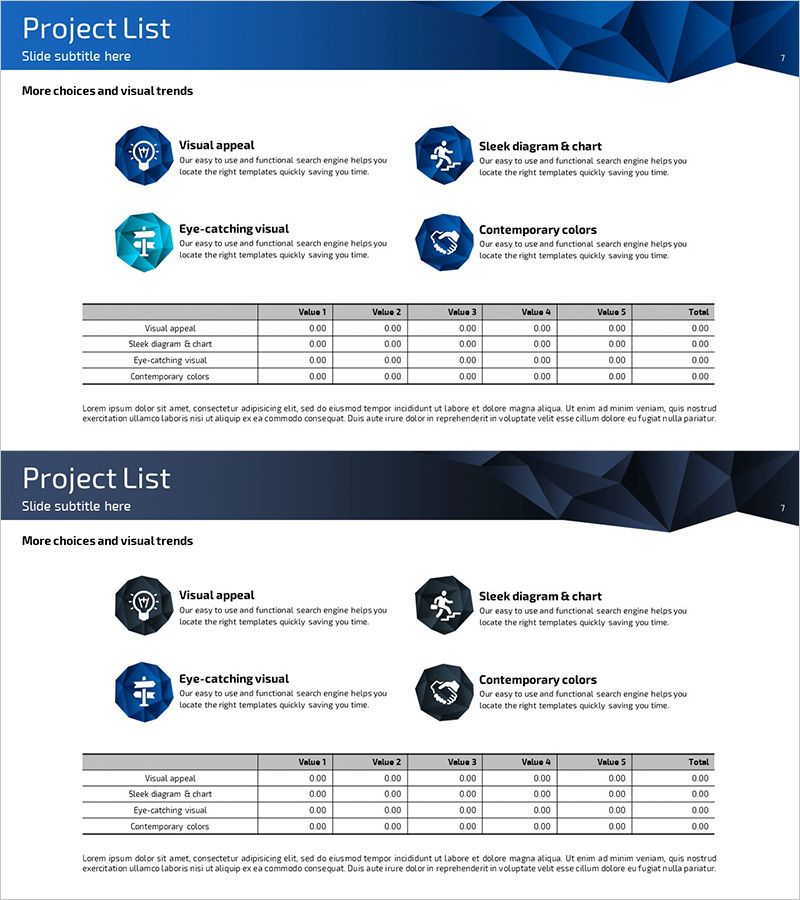
A professional income statement table PowerPoint slide designed to clearly present financial performance and planning data. The slide features a horizontal table structure with five data columns (Value 1 through Value 5) plus a Total column, enabling side-by-side comparison of financial plans and actual results. The dark blue header contrasts with a white background to maximize data readability, while horizontal dividing lines separate each row for clear information organization. The two-slide set is optimized for 16:9 widescreen format and allows you to present multiple financial line items. Provided in editable PPTX format, you can customize colors and data to match your company's branding and specific financial metrics.
Usage Points
-
Main Usage
This slide is designed for financial reports, business plans, and investor pitch decks where income statement data needs systematic presentation. The five-column layout allows direct comparison of financial figures, making it ideal for communicating financial performance trends and analyzing budget versus actual results.
-
How to Use
Enter your actual financial figures directly into the table cells. Input quarterly, annual, or departmental data into each Value column, and add rows as needed to display additional line items. Colors and fonts can be adjusted to align with your company's brand guidelines and presentation standards.
-
Recommended For
CFOs, finance managers, executives, and investor relations professionals presenting financial status. Ideal for quarterly earnings presentations, annual financial reports, investor briefings, and executive management meetings.
-
Slide Structure
Two-slide set, each featuring a horizontal table with five data columns (Value 1–5) plus a Total column. The header row uses a dark blue background with white text, while data rows are separated by horizontal lines for easy row-by-row information scanning and comprehension.
Related Products
-

Key Financial Indicators Table – Essential Information Visualization
#Financial Plans and Performance #Diagram #Income Statement
-

Key Financial Indicators Table – Trust and Professionalism
#Financial Plans and Performance #Diagram #Income Statement
-

Sales and Profit Table – Statistical Financial Performance
#Financial Plans and Performance #Diagram #Sales and Revenue
-

Table Chart of Point Frames – Profit and Loss Statement and Key Financial Metrics
#Financial Plans and Performance #Diagram #Income Statement
