Annual Content Trend Evolution – Market Trend Analysis
RJ0300044_15
- Last Update 04/29/2025
- File Size 0.2MB
- # of Slides 2
- File Format PPTX
- Slide Ratio 16:9
- Color
Keywords
- #Content-Based Slides
- #Design-Based Slides
- #Market and Competitor Analysis
- #Diagram
- #Graph
- #Industry Trends
- #Cluster
- #Line
- #Closed Cluster Diagram
- #Line Chart
- #16:9
- #line chart PowerPoint
- #trend data visualization slides
- #market analysis presentation
- #year-over-year comparison chart
- #multi-series graph PowerPoint template
About the Product
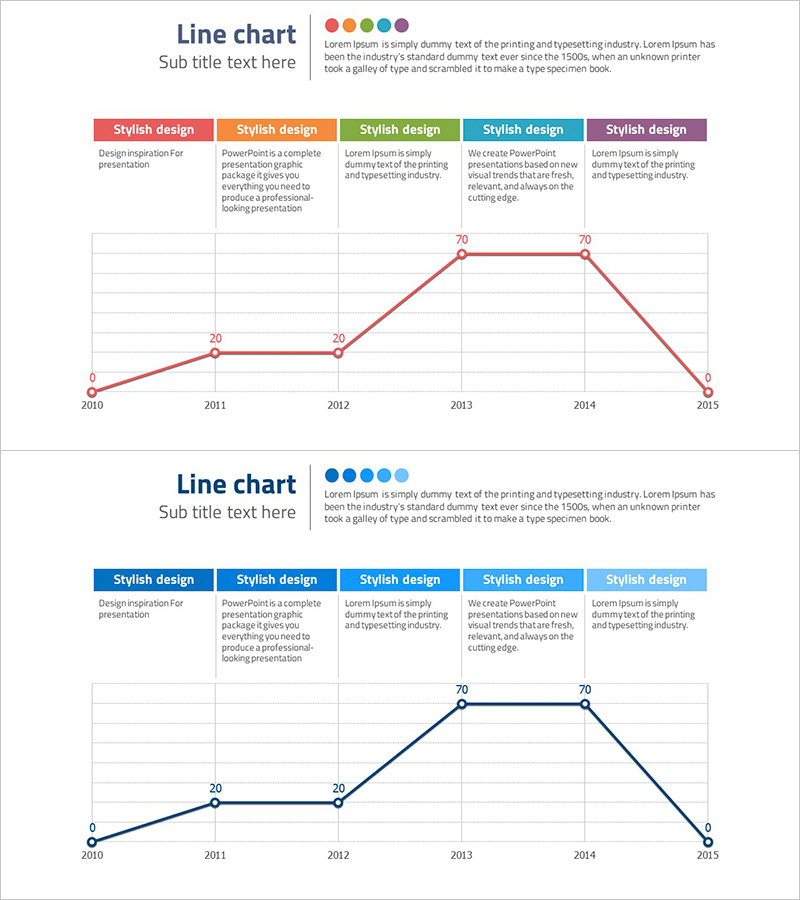
A multi-series line chart PowerPoint slide visualizing annual content trend evolution across a 6-year period (2010–2015). This 2-slide set features five color-coded series (red, orange, green, blue, purple) with data points, value labels, and gridlines for clear trend comparison. Ideal for market analysis presentations, competitive benchmarking, and performance reporting. Delivered in 16:9 widescreen PPTX format, fully editable in all PowerPoint versions.
Usage Points
-
Main Usage
Clearly communicate year-over-year, quarterly, or monthly performance trends through line visualization. Effectively display market dynamics, revenue growth, customer acquisition, and content trend shifts. Ideal for executive dashboards, investor pitch decks, and strategic business reviews where temporal data patterns drive decision-making.
-
How to Use
Double-click data points and value labels to input your actual figures. Edit axis labels, legend text, and color scheme to match your corporate branding. Adjust gridlines and background styling to align with your presentation theme. All elements remain fully editable in PowerPoint.
-
Recommended For
Executive leadership presenting quarterly/annual performance reviews, investors evaluating growth trajectories, marketing teams analyzing market share and customer acquisition trends, sales departments showcasing regional or product-line performance, consultants delivering industry trend analysis and competitive benchmarking reports.
-
Slide Structure
2-slide set. Each slide contains a line chart with 6 data points (2010–2015), 1–2 data series, value labels (0–70 range), year axis, numeric axis, gridlines, top legend bar with 5 color tabs, and descriptive text area below the chart.
Related Products
-

Graph of Industrial Change and Global Market Analysis – Understanding Market Trends
#Market and Competitor Analysis #Diagram #Graph
-

Typographic Wide Template Line Chart – Effective Data Visualization for Market Analysis
#Market and Competitor Analysis #Diagram #Graph
-

Interior Market Analysis Graph – Insights into Market Status
#Market and Competitor Analysis #Diagram #Graph
-

Current Status and Prospects of Cultivation – Market Analysis Graph
#Market and Competitor Analysis #Graph #Future Outlook
