Line Graph of Sugar Intake by Year – Market Trends and Future
RJ0400034_6
- Last Update 05/26/2025
- File Size 2.7MB
- # of Slides 2
- File Format PPTX
- Slide Ratio 16:9
- Color
Keywords
- #Content-Based Slides
- #Design-Based Slides
- #Company Introduction
- #Market and Competitor Analysis
- #Graph
- #History
- #Industry Trends
- #Line
- #Line Chart
- #16:9
- #line graph PowerPoint slide
- #trend analysis presentation template
- #year-over-year data visualization
- #line chart slide design
- #market trends PowerPoint
- #5-year trend analysis slide download
About the Product
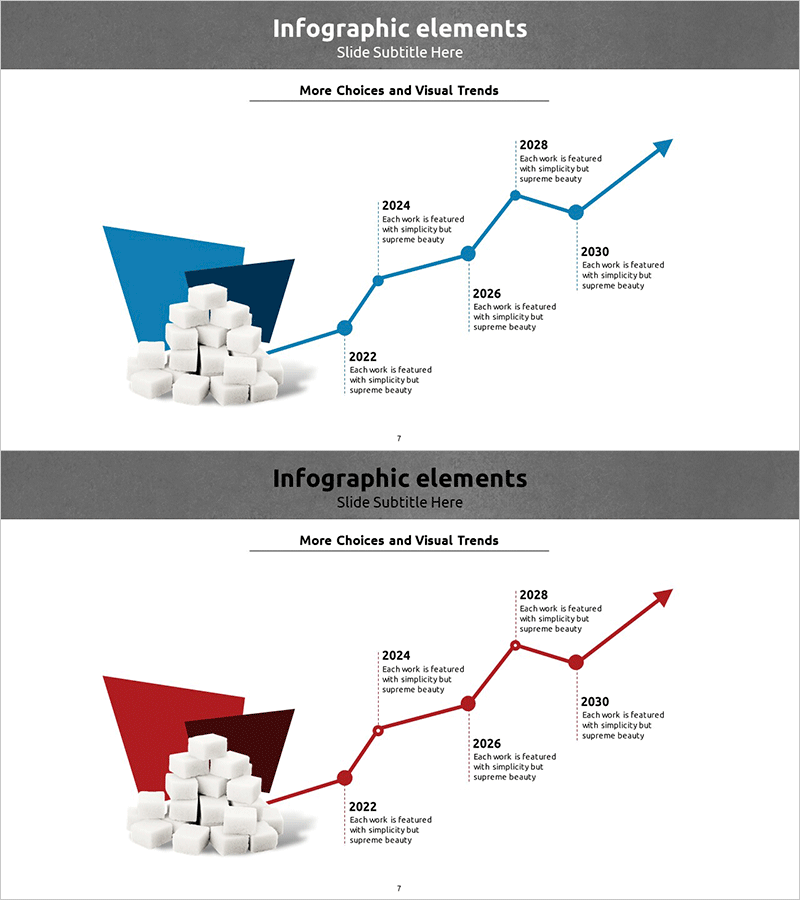
A two-slide PowerPoint presentation featuring line graphs to visualize year-over-year data changes from 2022 to 2030. This template includes two color versions—blue and red—each combining a 3D cube stack element on the left with a line chart on the right to communicate market trends, growth rates, and performance metrics. The 16:9 widescreen PPTX format is fully editable and ready for immediate use in business presentations covering sales volume, customer satisfaction, cost analysis, and other key performance indicators.
Usage Points
-
Main Usage
Effectively visualize numerical changes, trends, and growth rates over time. Ideal for presenting continuous data such as sales figures, customer satisfaction scores, expenses, and market share across five key time points to support strategic decision-making.
-
How to Use
Use the 3D cube element on the left as a visual anchor for your topic. Replace the line graph data points with your actual figures. Select the blue version to emphasize stability and trust, or the red version to highlight growth and urgency, depending on your presentation context.
-
Recommended For
Financial reports, marketing performance reviews, business plans, investor pitch decks, and executive briefings. Ideal for finance professionals, data analysts, business strategists, and sales leaders who need to communicate time-series data persuasively.
-
Slide Structure
Two slides in 16:9 format. Each slide features a 3D cube stack (blue or red) on the left side, paired with a line graph on the right displaying five data points connected by a trend line. Year labels (2022, 2024, 2026, 2028, 2030) and a title area are included.
Related Products
-

Year-by-Year Comparative Analysis Line Graph – Market Trend Insights
#Market and Competitor Analysis #Graph #Market Status
-

A Continuously Growing Broken Line Graph – Market Trends and Future Outlook
#Market and Competitor Analysis #Graph #Future Outlook
-

Market Trend Line Graph – Business Strategy
#Business Strategy #Market and Competitor Analysis #Graph
-

Trend Color Wide Template Line Chart – Market Trend Analysis
#Market and Competitor Analysis #Graph #Future Outlook
