Market Environment Analysis Chart – A Visual Indicator for Data Analysis
RM0200003_13
- Last Update 02/01/2025
- File Size 3.5MB
- # of Slides 2
- File Format PPTX
- Slide Ratio 16:9
- Color
Keywords
- #Content-Based Slides
- #Design-Based Slides
- #Product/Service Introduction
- #Market and Competitor Analysis
- #Diagram
- #Graph
- #Development Status
- #Market Analysis
- #Table
- #Circles
- #Doughnut Chart
- #16:9
- #donut chart PowerPoint slide
- #pie chart template
- #market analysis donut graph
- #ratio data visualization
- #donut chart download
- #market environment analysis PPT
About the Product
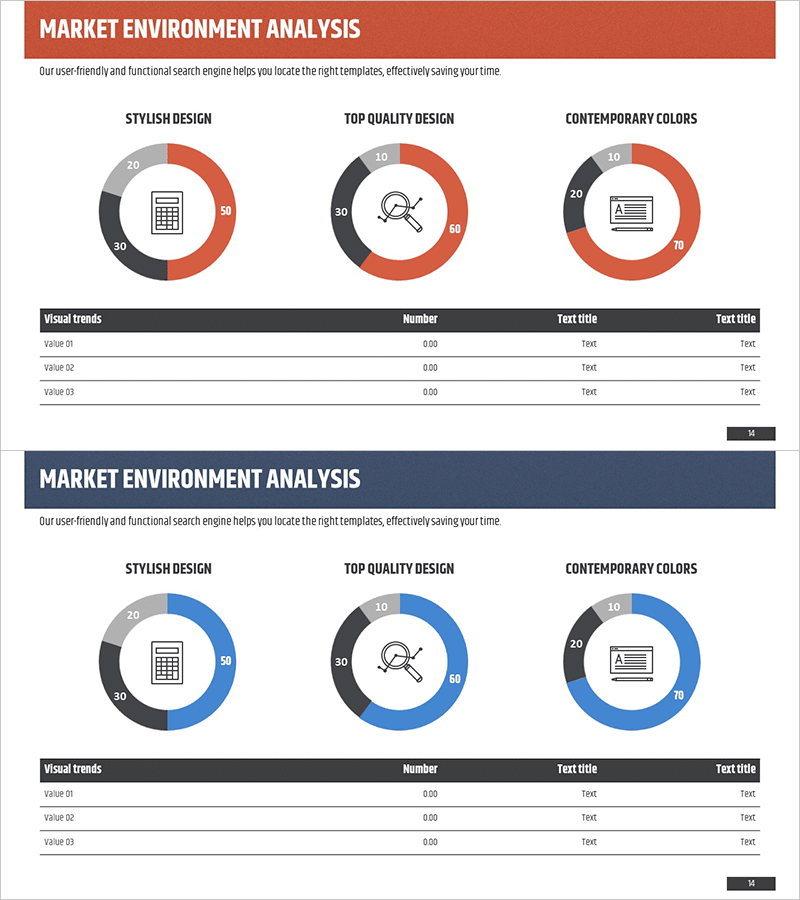
A donut-shaped pie chart PowerPoint slide designed for market environment analysis presentations. The donut chart features three color segments—coral red, gray, and dark gray—to visualize market share, customer preferences, competitive positioning, and ratio-based data with clarity. Each slide incorporates a central icon (calculator, magnifying glass, document) that reinforces the analytical context and data-driven narrative. This 16:9 widescreen 2-slide set integrates seamlessly into business reports, marketing plans, and investor presentations. All chart elements are fully editable, allowing you to update values and labels to match your specific data.
Usage Points
-
Main Usage
Visualizes the relationship between parts and whole—ideal for displaying market share, customer preference distribution, competitive landscape, and product category ratios. The central icon clearly identifies the analytical focus (finance, marketing, operations), enhancing audience comprehension and engagement.
-
How to Use
Deploy in the market analysis section of business plans, quarterly performance reports, marketing strategy presentations, and product launch decks to explain market positioning. Double-click chart elements to edit values and labels directly within PowerPoint.
-
Recommended For
Executives, marketing teams, sales professionals, and business strategists presenting to stakeholders, investors, and clients. Ideal when quantitative, data-driven credibility is essential for decision-making discussions.
-
Slide Structure
Two-slide layout, each featuring a three-segment donut chart. Slide 1 centers on a calculator icon; Slide 2 uses magnifying glass and document icons to differentiate analytical themes. Each donut displays a 50% coral-red, 30% gray, and 20% dark-gray segment distribution.
Related Products
-

Mobile Development Status Analysis Graph – Market Analysis and Competitiveness
#Product/Service Introduction #Market and Competitor Analysis #Diagram
-

Development Status Analysis Chart - Visualization for Effective Market Analysis
#Product/Service Introduction #Market and Competitor Analysis #Diagram
-

Business Investment Market Analysis Donut Graph
#Product/Service Introduction #Market and Competitor Analysis #Diagram
-

Detailed Analysis in Book Illustration PowerPoint Template
#Market and Competitor Analysis #Diagram #Graph
