Doughnut Chart Slide for 3D Printing Machine Technology Status
RJ0400036_22
- Last Update 05/27/2025
- File Size 0.8MB
- # of Slides 2
- File Format PPTX
- Slide Ratio 16:9
- Color
Keywords
- #Content-Based Slides
- #Design-Based Slides
- #Product/Service Introduction
- #Market and Competitor Analysis
- #Graph
- #Development Status
- #Market Analysis
- #Circles
- #Doughnut Chart
- #16:9
- #doughnut chart PowerPoint slide
- #pie chart presentation template
- #ratio comparison slide
- #3D printing technology presentation
- #data visualization PPT
- #how to create doughnut chart in PowerPoint
About the Product
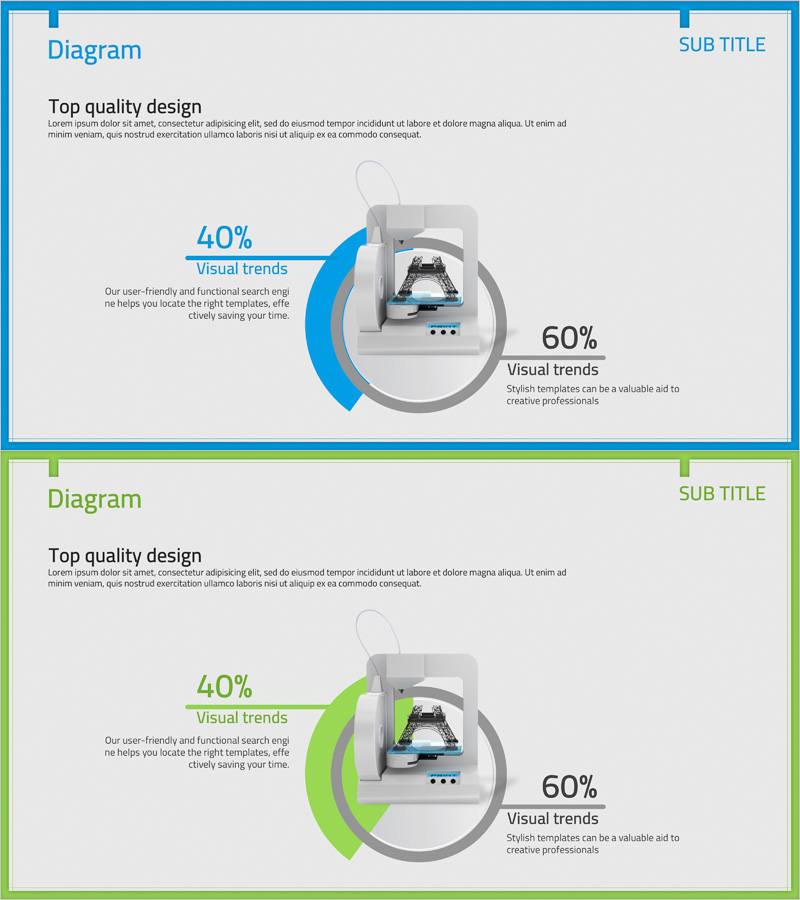
A doughnut chart PowerPoint slide that visualizes 3D printing machine technology status and market trends. The slide features a two-color doughnut chart (blue and green versions) displaying data ratios of 40% and 60% in an intuitive, easy-to-understand format. This 2-slide set includes both color variations, allowing you to use different versions for various data comparisons in technical presentations, business reports, and technology briefings. The 16:9 widescreen PPTX format is fully editable in all PowerPoint versions.
Usage Points
-
Main Usage
Use this slide to compare and analyze 3D printing technology market status or technology trends by ratio. The doughnut chart clearly expresses the composition of parts relative to the whole, making it ideal for emphasizing key figures in technical reports, market analysis presentations, and competitive analysis materials.
-
How to Use
Simply replace the 40% and 60% figures and accompanying text with your own data. Two versions are provided—blue and green—so you can use different colors for different presentation sections or arrange both slides consecutively for comparative analysis. All shapes and text are fully editable.
-
Recommended For
Recommended for technology company business reports, 3D printing product introduction presentations, technology trend analysis materials, market research reports, and executive briefings. Ideal for technology marketing teams, product planning teams, business analysis teams, and technical sales teams.
-
Slide Structure
Each slide features a title area at the top, a doughnut chart with circular background in the center, and ratio figures (40%, 60%) with descriptive text positioned on the left and right sides. The doughnut chart consists of two data series, with blue and green versions provided in identical layouts.
Related Products
-

Mobile Development Status Analysis Graph – Market Analysis and Competitiveness
#Product/Service Introduction #Market and Competitor Analysis #Diagram
-

Development Status Analysis Chart - Visualization for Effective Market Analysis
#Product/Service Introduction #Market and Competitor Analysis #Diagram
-

Businessman Cartoon Theme Circle Graph – Market Analysis and Competitiveness
#Product/Service Introduction #Market and Competitor Analysis #Graph
-

Port Transport Data & Comparison Chart – Optimized for Market and Competitor Analysis
#Product/Service Introduction #Market and Competitor Analysis #Graph
