Colors Theme Presentation Template Table – Financial Planning and Performance
RJ0200043_29
- Last Update 04/10/2025
- File Size 0.3MB
- # of Slides 2
- File Format PPTX
- Slide Ratio 16:9
- Color
Keywords
- #Content-Based Slides
- #Design-Based Slides
- #Financial Plans and Performance
- #Diagram
- #Sales and Revenue
- #Key Financial Indicators
- #Table
- #Standard Table
- #16:9
- #financial data table PowerPoint
- #financial table slide template
- #revenue analysis presentation
- #quarterly performance report
- #financial metrics PowerPoint slide
About the Product
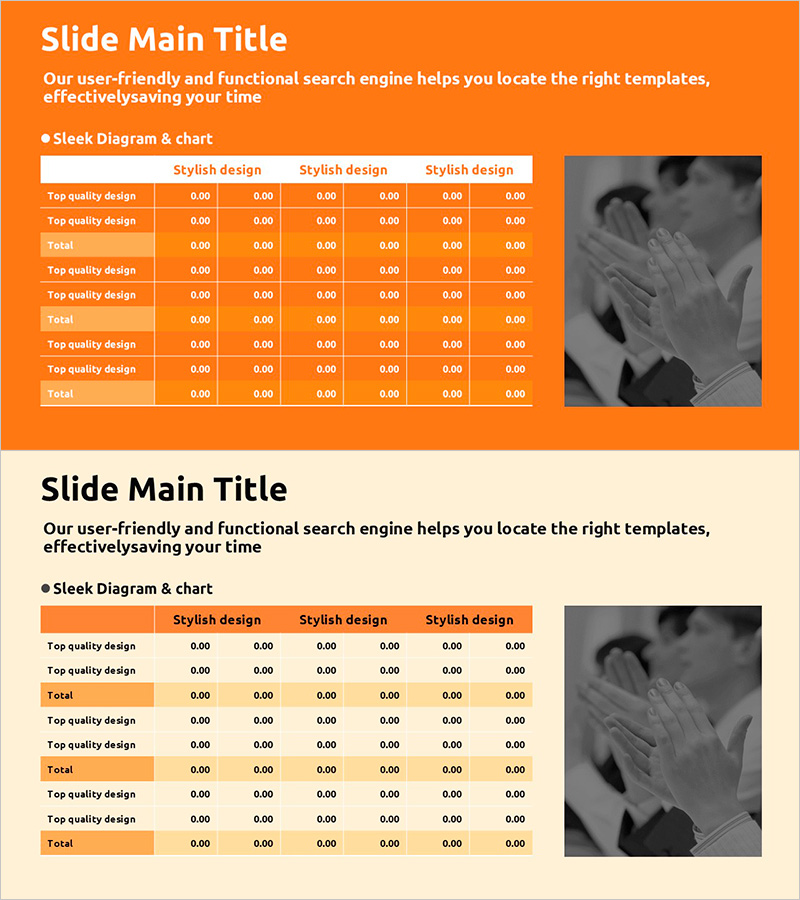
A 6-column data table PowerPoint slide designed for financial planning and revenue analysis presentations. The bright orange header contrasts with the white background to clearly display numerical information, while row dividers enhance data readability. This presentation template is ready to use for organizing quantitative data such as sales growth, key financial metrics, and quarterly performance comparisons. The 16:9 widescreen format with 2 slides allows you to efficiently visualize various financial information in your business reports and investor presentations.
Usage Points
-
Main Usage
Display quantitative financial data such as revenue, profit, and expenses in financial reports, quarterly earnings presentations, and investor briefings. The clearly separated rows and columns allow stakeholders to quickly understand complex financial figures and performance trends.
-
How to Use
Enter actual financial figures into the slide cells to compare quarterly or annual performance, analyze budget versus actual results, and present departmental sales status. Use the orange header to highlight key metrics and the white cells as input areas for your data.
-
Recommended For
CFOs, finance managers, and executives presenting financial performance at shareholder meetings, board meetings, and investor conferences. Also suitable for business plans, annual reports, and financial analysis documents that require quantitative evidence.
-
Slide Structure
A data table with 6 columns and 8-9 rows. The first row features an orange background header displaying item names, while remaining rows have white backgrounds with black text for numerical data entry. Row dividers clearly separate each item for improved visual organization.
Related Products
-

Cost Table by Beans – Unique Financial Analysis
#Financial Plans and Performance #Diagram #Sales and Revenue
-

Line PPT Table (Green & Orange) – Visualizing Financial Performance Data
#Financial Plans and Performance #Diagram #Sales and Revenue
-

Quality PowerPoint Table Template for Financial Performance Visualization
#Financial Plans and Performance #Diagram #Sales and Revenue
-

Visualizing Key Financial Indicators with Diagram Presentation
#Financial Plans and Performance #Diagram #Sales and Revenue
