Cost Table by Beans – Unique Financial Analysis
RJ0600075_16
- Last Update 07/10/2025
- File Size 3MB
- # of Slides 2
- File Format PPTX
- Slide Ratio 16:9
- Color
Keywords
About the Product
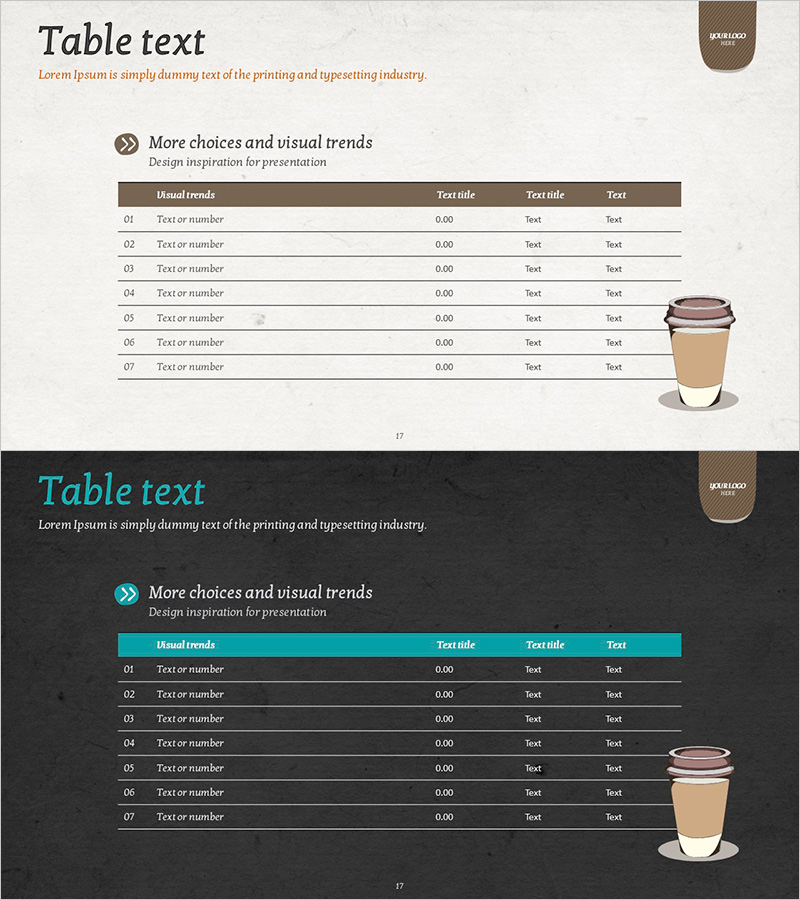
A 7-row cost analysis table PowerPoint slide designed for bean-by-bean cost breakdown and financial reporting. The brown header row contrasts with the white background to ensure clear data visibility, with distinct input areas for numerical values and text fields. Two background color versions—beige and black—are provided to match your presentation tone. A coffee illustration on the right side complements beverage and food industry presentations. Fully editable PPTX format in 16:9 aspect ratio with 2 slides.
Usage Points
-
Main Usage
This table slide is designed for cost analysis, expense comparison, and financial data organization. The clearly separated row numbers, item names, and numerical input fields allow you to present various financial metrics such as bean-specific costs, selling prices, and profit margins in a structured format.
-
How to Use
Use this slide in business plans, financial reports, and product cost analysis presentations to explain cost structures. The brown header version suits warm-toned presentations, while the black header version works for professional corporate settings. Simply input your actual data into each cell for immediate use.
-
Recommended For
Finance professionals, executives, and food and beverage industry specialists presenting cost analysis, profitability reviews, and product-by-product cost comparisons. Ideal for investor presentations, internal management meetings, and business planning sessions where cost data visualization is essential.
-
Slide Structure
Two-slide set with slide 1 featuring a beige background and slide 2 with a black background. Each slide contains a brown header row with item names and three text fields, followed by 7 data rows. Row numbers (01–07) are positioned on the left, numerical input areas in the center, and a coffee illustration on the right side.
Related Products
-

Colors Theme Presentation Template Table – Financial Planning and Performance
#Financial Plans and Performance #Diagram #Sales and Revenue
-

Grain Yield Table – Financial Planning and Performance
#Financial Plans and Performance #Diagram #Sales and Revenue
-

Logistics Factor Comparison Table – Intuitive Data Analysis
#Financial Plans and Performance #Diagram #Sales and Revenue
-

Sales and Profit Analysis Table – Essential Tool for Presentation
#Financial Plans and Performance #Diagram #Other
