Grain Yield Table – Financial Planning and Performance
RJ0600096_7
- Last Update 07/17/2025
- File Size 0.7MB
- # of Slides 2
- File Format PPTX
- Slide Ratio 16:9
- Color
Keywords
- #Content-Based Slides
- #Design-Based Slides
- #Financial Plans and Performance
- #Diagram
- #Sales and Revenue
- #Key Financial Indicators
- #Table
- #Standard Table
- #16:9
- #grain yield table PowerPoint
- #financial data table slide
- #6-column comparison slide
- #agricultural performance table PPT
- #numerical comparison PowerPoint
- #table slide template download
About the Product
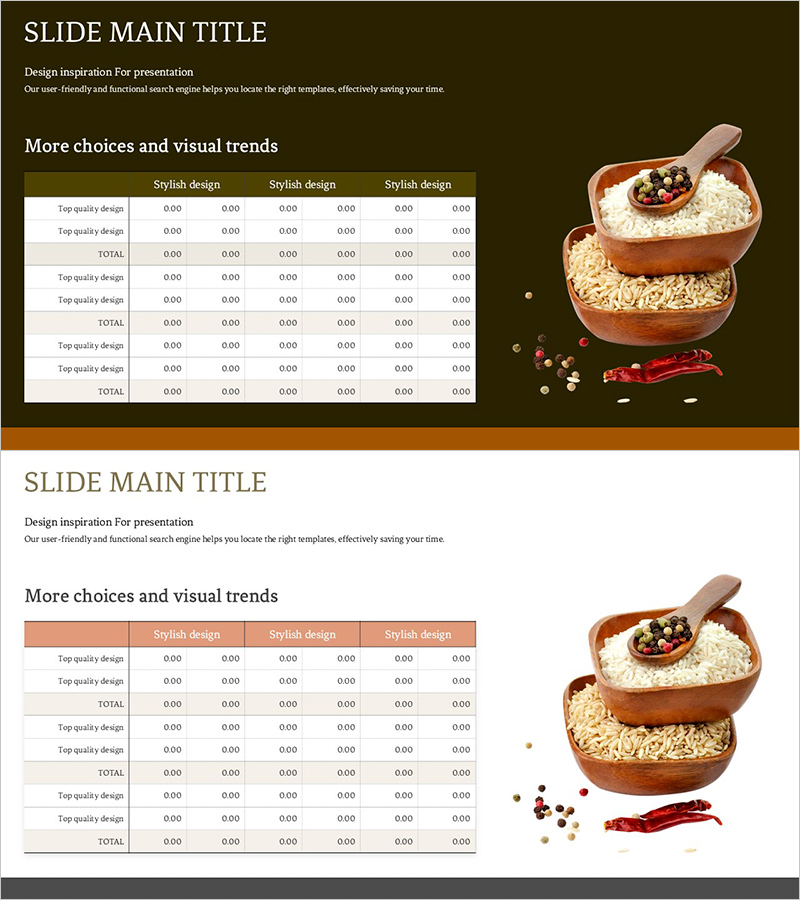
A table-based PowerPoint slide for comparing grain yield and financial performance at a glance. This 2-slide presentation features a brown background with beige headers, displaying six columns of numerical data in an organized format. Ideal for agricultural business plans, financial reports, and performance analysis presentations. Each row includes a 'Top quality design' label and a total row to clearly structure the data. Fully editable and ready to use immediately in your presentation.
Usage Points
-
Main Usage
Visualize agricultural harvest data and financial performance simultaneously to communicate business results clearly to executives and investors. The organized table format with six columns enables easy comparison and analysis of numerical data.
-
How to Use
Insert into the financial section of business plans, quarterly performance reports, or investor pitch decks. Replace row values with actual data and modify header text to create presentation-ready materials in minutes.
-
Recommended For
Agricultural companies, food manufacturers, and produce distribution firms. Finance managers, executives, and investor relations professionals who need data-driven decision-making support for quarterly reviews and business expansion planning.
-
Slide Structure
Two slides with brown header sections (3 column titles) and beige data tables (6 columns × 8-9 rows). Each row displays 'Top quality design' labels and numerical values in 0.00 format, with a TOTAL row summarizing each section.
Related Products
-

Cost Table by Beans – Unique Financial Analysis
#Financial Plans and Performance #Diagram #Sales and Revenue
-

Sales and Profit Table – Statistical Financial Performance
#Financial Plans and Performance #Diagram #Sales and Revenue
-

Sales and Profit Analysis Table – Essential Tool for Presentation
#Financial Plans and Performance #Diagram #Other
-

Logistics Factor Comparison Table – Intuitive Data Analysis
#Financial Plans and Performance #Diagram #Sales and Revenue
