Infographic Design Wide Template Line Chart
RJ0200064_14
- Last Update 10/17/2025
- File Size 0.3MB
- # of Slides 2
- File Format PPTX
- Slide Ratio 16:9
- Color
Keywords
- #Content-Based Slides
- #Design-Based Slides
- #Market and Competitor Analysis
- #Marketing Plan and Strategy
- #Graph
- #Market Status
- #Pricing Strategy
- #Line
- #Line Chart
- #16:9
- #line chart PowerPoint
- #trend analysis slide template
- #market data visualization
- #marketing performance graph
- #dual-series chart download
About the Product
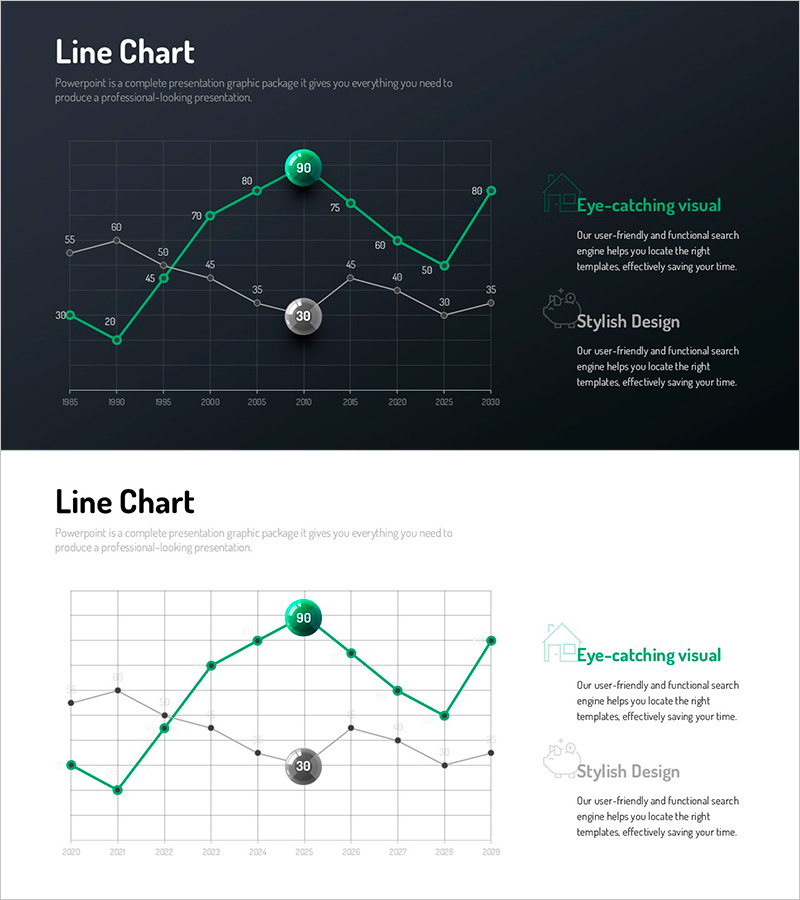
A professional line chart PowerPoint slide optimized for market analysis and marketing strategy presentations. Two data series are visualized in green accent tones against a dark background, clearly showing trends over time. The grid background and data point markers enable precise value reading, while the right-side text area accommodates key insights and analysis. Formatted in 16:9 widescreen with 2 slides, this presentation template is ready for immediate use in reports and business presentations.
Usage Points
-
Main Usage
Displays numerical changes and trends over time by comparing two or more data series simultaneously. Ideal for presenting marketing performance, sales trends, market dynamics, and other time-series data that reveal patterns and correlations between variables.
-
How to Use
Input your actual data into the line chart, then add analysis results and key insights in the right-side text area. The green accent color scheme can be customized to match your brand guidelines, and the grid lines and data point markers are fully adjustable based on your presentation needs.
-
Recommended For
Marketing professionals, executives, data analysts, and consultants presenting business performance reports, market analysis, and strategic planning. Suitable for quarterly performance reviews, campaign effectiveness analysis, competitive benchmarking, and other business scenarios requiring credible data visualization.
-
Slide Structure
Both slides feature identical layouts with a dual-series line chart on the left (approximately 10 data points with grid background) and title/description text area on the right. Dark charcoal background with green accent lines, circular data point markers, and gray secondary series create strong visual contrast and readability.
Related Products
-

Consumer Insights & Behavioral Patterns Analysis Slide
#Market and Competitor Analysis #Graph #Market Status
-

Electricity and Water Usage Graphs – Market Status and Future Trends
#Market and Competitor Analysis #Graph #Market Status
-

Building Trends Line Chart – Visual Tool for Performance Analysis
#Business Strategy #Market and Competitor Analysis #Graph
-

Purple Green Flower Market Analysis – Market Status and Competitive Analysis
#Market and Competitor Analysis #Financial Plans and Performance #Graph
