Ratio Infographic Analysis Chart – Optimized for Market Analysis
RB0800009_16
- Last Update 03/19/2025
- File Size 3.3MB
- # of Slides 2
- File Format PPTX
- Slide Ratio 4:3
- Color
Keywords
- #Content-Based Slides
- #Design-Based Slides
- #Market and Competitor Analysis
- #Diagram
- #Graph
- #Other
- #Market Status
- #Market Analysis
- #Cluster
- #Closed Cluster Diagram
- #4:3
- #hexagon diagram PowerPoint
- #closed diagram slide template
- #3-color infographic presentation
- #pie chart diagram PowerPoint
- #market analysis presentation template
About the Product
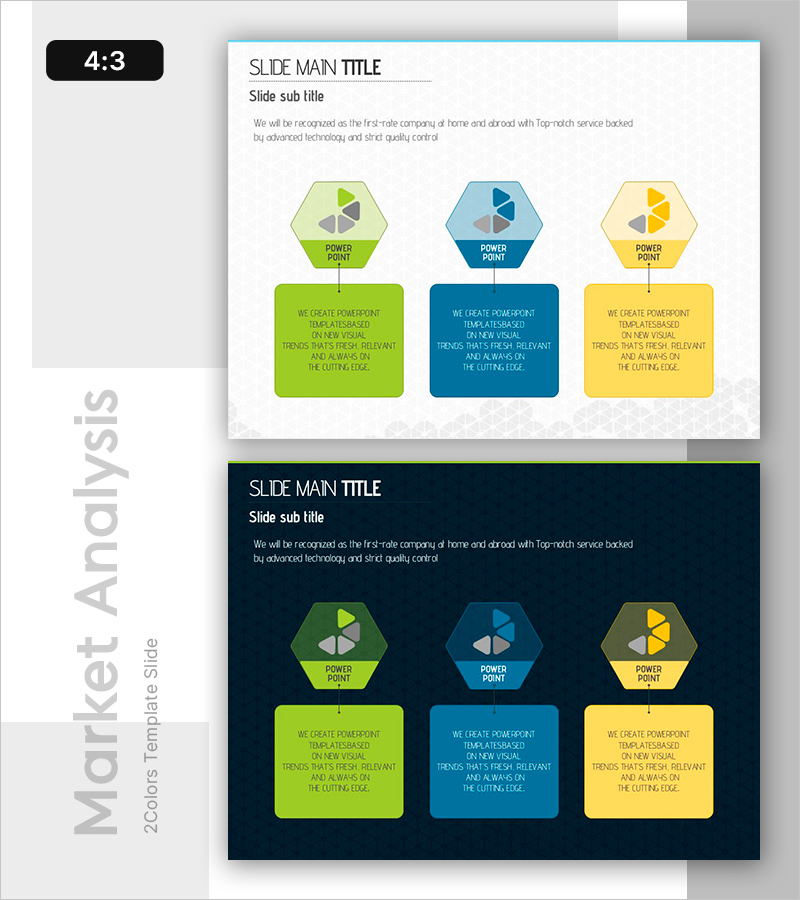
A 2-slide PowerPoint template featuring hexagon closed diagrams with pie chart icons. The design uses three distinct colors—lime green, navy blue, and golden yellow—arranged in a hierarchical structure. Each hexagon node contains a pie chart icon, connected to a rectangular text box below for detailed descriptions. This PowerPoint slide set is optimized for presenting three key strategic points, market analysis dimensions, or business model components simultaneously. Available in 4:3 aspect ratio PPTX format, fully editable and ready to use.
Usage Points
-
Main Usage
Designed to visually present three core strategic points, analysis dimensions, or business components in parallel. The hierarchical structure—hexagon nodes above, descriptive text boxes below—supports layered information delivery and comparative analysis.
-
How to Use
Use in market analysis slides to represent three analytical axes (competitors, market, customers), or in strategy sections to present three key initiatives side-by-side. Color-code each hexagon to distinguish departments, teams, or categories. Customize text in boxes for detailed explanations.
-
Recommended For
Ideal for marketing plans, business proposals, strategy reports, and investor pitch decks. Recommended for consulting firms, marketing teams, strategic planning departments, and sales presentations requiring multi-dimensional comparison.
-
Slide Structure
2-slide set. Each slide contains three hexagon nodes (lime, navy, yellow) with pie chart icons, connected via vertical lines to three rectangular text boxes below. The closed diagram structure emphasizes relationships and hierarchical organization.
Related Products
-

Hiking Illustration Icons and Volume Charts – Market Analysis Slide
#Market and Competitor Analysis #Graph #Other
-

Market Analysis with Area Charts
#Market and Competitor Analysis #Graph #Other
-

Idea Presentation Template Wide – Market Analysis and Visualization
#Market and Competitor Analysis #Graph #Other
-

Horizontal Bar Chart Slide for USA Market Analysis
#Market and Competitor Analysis #Graph #Other
