Table Chart Related to Space Industry – Insights from Market Analysis
RJ0700020_22
- Last Update 07/27/2025
- File Size 1.1MB
- # of Slides 2
- File Format PPTX
- Slide Ratio 16:9
- Color
Keywords
- #Content-Based Slides
- #Design-Based Slides
- #Market and Competitor Analysis
- #Diagram
- #Market Analysis
- #Cluster
- #Table
- #Closed Cluster Diagram
- #Standard Table
- #16:9
- #table chart PowerPoint
- #data comparison slide template
- #market analysis presentation
- #business data visualization
- #comparison table PPT download
About the Product
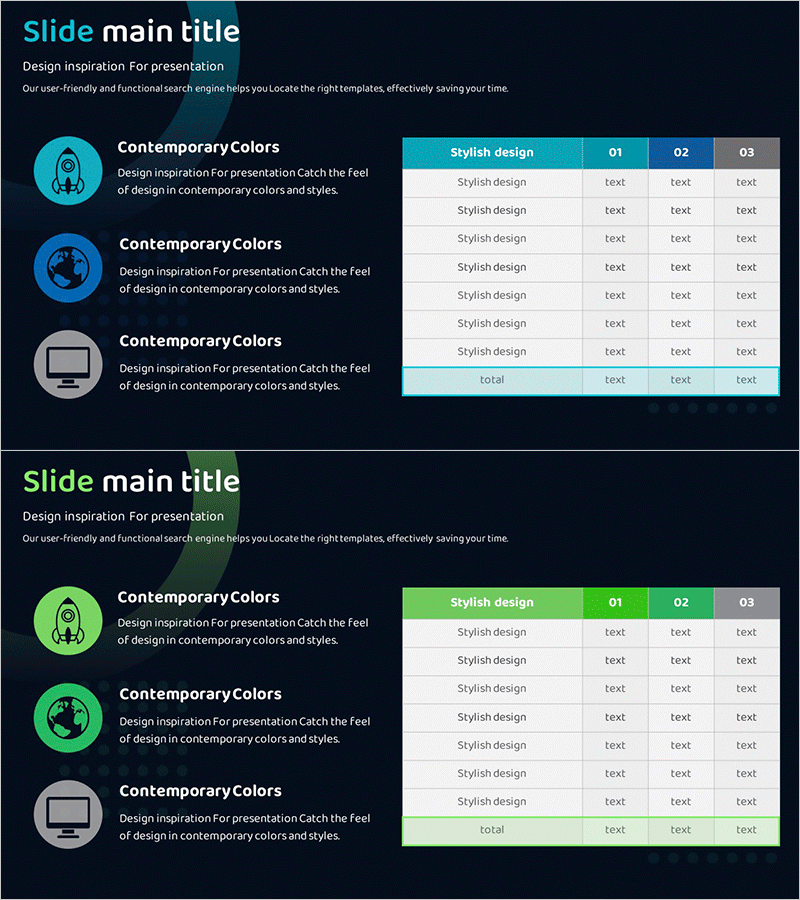
A table chart PowerPoint slide designed for space industry market analysis presentations. Features a teal header with three columns (01, 02, 03) and six data rows arranged in a structured grid format. The left side displays three icon-labeled information sections (rocket, globe, monitor) with descriptive text, while the right side contains the comparison table for systematic data organization. This presentation slide effectively transforms complex datasets into clear, comparable information for business reports, market analysis, and strategic presentations.
Usage Points
-
Main Usage
Organizes complex data in tabular format for comparative analysis across industries including aerospace, IT, and manufacturing. The slide combines icon-based category labels on the left with a structured data table on the right, enabling clear visualization of market trends, competitive comparisons, and product specifications. Facilitates data-driven decision-making in executive presentations.
-
How to Use
Insert this slide in market analysis, competitive analysis, or product comparison sections of presentations. Replace column headers (01, 02, 03) with your comparison criteria and populate rows with corresponding data. Modify left-side icons and labels to match your presentation theme. Customize colors to align with corporate branding guidelines. All table cells are fully editable.
-
Recommended For
Recommended for aerospace, space industry, defense, IT, telecommunications, and manufacturing sector presentations including business plans, proposals, investor pitches, and market analysis reports. Ideal for executive teams, sales departments, marketing teams, and strategic planning groups presenting data-driven insights.
-
Slide Structure
Two-slide set: First slide features teal header table (3 columns × 6 rows) with left-side icon descriptions. Second slide presents green header table (3 columns × 7 rows) as a color variant. Both tables include header row, data rows, and total row. All cells are editable for customization.
Related Products
-

Big Data Market Analysis Graph – Trends and Performance
#Market and Competitor Analysis #Financial Plans and Performance #Diagram
-

Business Idea Development Analysis Circle Graph
#Business Introduction #Market and Competitor Analysis #Diagram
-

Experimental Results Analysis Vertical Bar Graph – Incorporating Visual Trends
#Market and Competitor Analysis #Diagram #Graph
-

Business Status Chart – Presentation Template for Market Analysis
#Market and Competitor Analysis #Diagram #Graph
