4-Step Business Process Graph – Market Analysis and Technology Status
RJ0300048_5
- Last Update 05/01/2025
- File Size 6.1MB
- # of Slides 2
- File Format PPTX
- Slide Ratio 16:9
- Color
Keywords
- #Content-Based Slides
- #Design-Based Slides
- #Business Introduction
- #Market and Competitor Analysis
- #Graph
- #Technological Status
- #Market Analysis
- #Horizontal Bar
- #Segmented Horizontal Bar
- #16:9
- #horizontal bar chart PowerPoint
- #business process slide template
- #4-step comparison chart
- #data visualization slide
- #process analysis PowerPoint template
About the Product
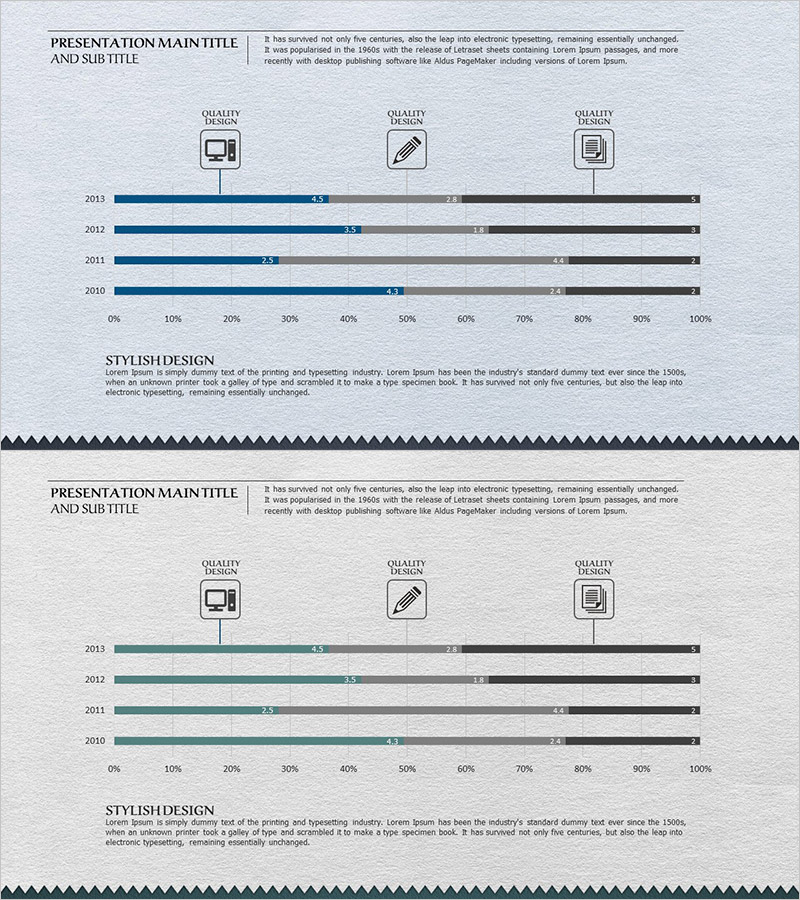
A horizontal bar chart PowerPoint slide designed for business process analysis across four stages. The two-tone color scheme of navy blue and gray clearly visualizes data comparison and sequential progress. Each stage displays quantitative metrics suitable for market analysis, technology status assessment, project tracking, and performance reporting. The 2-slide set is ready to edit and integrate into presentations, optimized for 16:9 widescreen format. Perfect for executives and stakeholders who need to compare multi-stage business metrics at a glance.
Usage Points
-
Main Usage
Designed to compare and analyze quantitative data across four business process stages using horizontal bar format. Effectively communicates market analysis, technology status, project progress, and performance metrics. Ideal for year-over-year, department-by-department, and item-by-item comparative analysis in executive presentations.
-
How to Use
Input numerical data into the four bar sections and update the legend labels to match your content. Use the navy blue bars for primary metrics and gray bars for comparative data to establish visual hierarchy. Edit the title and descriptive text to align with your presentation context and audience.
-
Recommended For
Recommended for executive reports, business plans, marketing proposals, technology status presentations, quarterly and annual performance reviews. Suitable for consulting firms, financial institutions, IT companies, and manufacturers presenting data-driven insights to C-suite executives and decision-makers.
-
Slide Structure
Two-slide set, each containing a 4-stage horizontal bar graph. Layout includes title area at top, central graph with four bars in navy-gray two-tone palette, and descriptive text area at bottom. Three quality design icons (monitor, pen, document) indicate design standards.
Related Products
-

Content Composition Breakdown by Year with Horizontal Bar Chart
#Business Introduction #Market and Competitor Analysis #Graph
-

Business Sector Analysis Chart – Multifaceted Visualization
#Business Introduction #Market and Competitor Analysis #Diagram
-

Visualizing Current Internet Shopping Payment Technologies with Horizontal Bar Graph
#Business Introduction #Market and Competitor Analysis #Graph
-

Split Bar Graph and Pill Shape Diagram – Highlighting Marketing Strategy
#Market and Competitor Analysis #Marketing Plan and Strategy #Diagram
