Competitor Analysis Broken Line Graph – Visualizing Market Trends
RJ0400011_19
- Last Update 05/20/2025
- File Size 0.3MB
- # of Slides 2
- File Format PPTX
- Slide Ratio 16:9
- Color
Keywords
About the Product
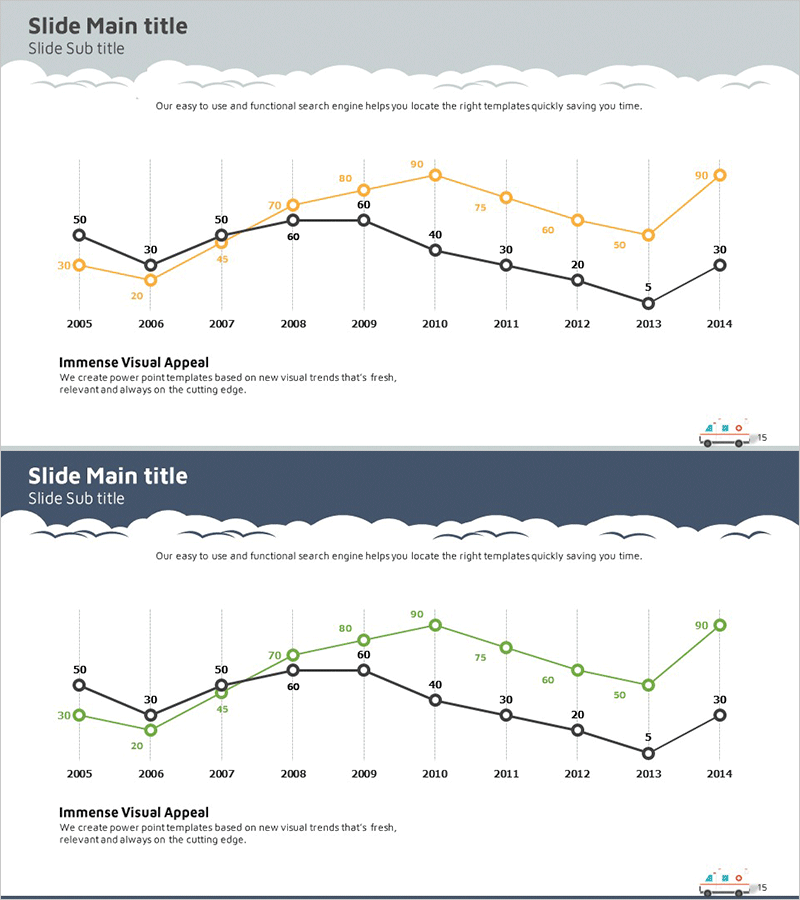
A PowerPoint slide that compares market trends across a 10-year period (2005–2014) using two distinct line series in black and orange. Each data point is labeled with numerical values, enabling precise comparison of changing metrics over time. The 16:9 widescreen format includes 2 slide designs: a light gray background version and a dark navy background version, making it adaptable to various presentation contexts. This slide deck is ready for immediate use in competitive analysis presentations, market share trend reports, revenue forecasting, and business performance reviews. The dual-color design ensures clear visual distinction between data series while maintaining professional appearance across different document styles.
Usage Points
-
Main Usage
Designed to visualize and compare the evolution of two or more data series over time, this slide excels at presenting competitive benchmarking, market share fluctuations, revenue and profit trends, and customer satisfaction metrics. The dual-line format enables stakeholders to quickly identify diverging or converging trends and make data-driven decisions.
-
How to Use
Ideal for executive briefings, quarterly business reviews, marketing strategy sessions, and investor presentations. Simply input your data, adjust the line colors and axis ranges as needed, and the slide is ready for presentation. The two background options allow you to match your corporate branding or document theme.
-
Recommended For
Executives, marketing managers, sales directors, business analysts, financial planners, and management consultants who need to communicate performance trends and competitive positioning. Particularly valuable for quarterly reviews, market analysis reports, and strategic planning discussions.
-
Slide Structure
Features two line series with 10 data points spanning 2005 to 2014. Each point displays a numerical label for precise value reading. A grid background aids in data interpretation. Two design variants are included: light gray and dark navy backgrounds for flexible application across different presentation contexts.
Related Products
-

Competitor Analysis Broken Line Graph – Visualizing Market Trends
#Market and Competitor Analysis #Graph #Other
-

Geometry Pattern Wide Line Chart PowerPoint Template - Market Trends and Competitor Analysis
#Market and Competitor Analysis #Graph #Competitor Analysis
-

Competitive Market Trend Analysis Graph – Visualizing Market Trends
#Market and Competitor Analysis #Graph #Competitor Analysis
-

Typographic Wide Template Line Chart – Effective Data Visualization for Market Analysis
#Market and Competitor Analysis #Diagram #Graph
