Medical Services Characteristics Connection Diagram
RJ0300026_17
- Last Update 04/24/2025
- File Size 0.3MB
- # of Slides 2
- File Format PPTX
- Slide Ratio 16:9
- Color
Keywords
- #Content-Based Slides
- #Design-Based Slides
- #Market and Competitor Analysis
- #Graph
- #Customer Analysis
- #Market Analysis
- #Column
- #Other
- #Segmented Column
- #Other Charts
- #16:9
- #vertical bar chart PowerPoint
- #infographic slide template
- #medical services analysis
- #data comparison diagram
- #healthcare industry presentation slide
About the Product
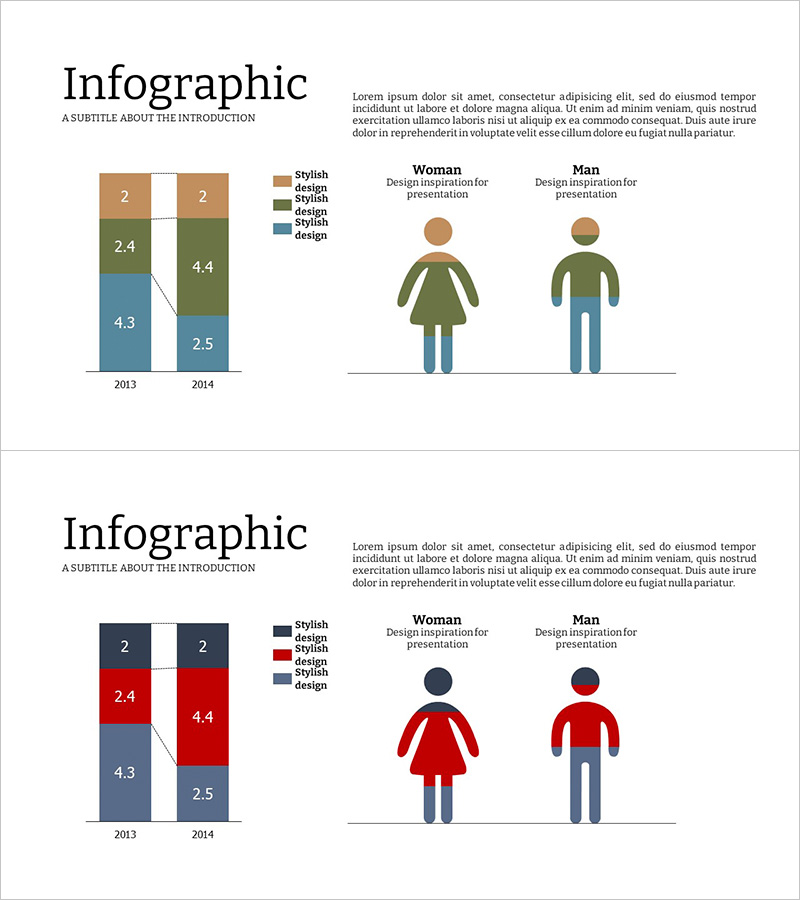
A vertical bar chart PowerPoint slide that visually compares medical services characteristics across two years. The slide presents 2013 and 2014 data organized into four data series, clearly showing year-over-year trends and variations. Four distinct colors—brown, green, gray, and blue—differentiate each category, while female and male silhouettes enhance the infographic format. This presentation template is ready to use in healthcare industry reports, market analysis documents, customer segmentation presentations, and business strategy decks.
Usage Points
-
Main Usage
Communicate medical services market data through year-over-year and category-by-category comparison, highlighting customer segmentation differences between female and male demographics. Effectively conveys data-driven insights in healthcare industry reports, business plans, and marketing strategy presentations, particularly in market analysis sections.
-
How to Use
Slide 1 displays a vertical bar chart comparing four metrics (ranging 2.0–4.4) for 2013 and 2014, with a color-coded legend. Slide 2 combines the same chart with female and male silhouettes to illustrate target customer characteristics. Click any color series to edit data values, and modify axis labels and legend text to match your dataset.
-
Recommended For
Healthcare executives, marketing teams, and sales professionals presenting market updates, customer analysis results, and service improvement strategies. Recommended for hospitals, medical institutions, pharmaceutical companies, and healthcare startups delivering investor presentations, quarterly performance reports, and new service launch announcements.
-
Slide Structure
Slide 1: Title 'Infographic' + descriptive text + vertical bar chart (two bars for 2013 and 2014, four color-coded series, numeric labels) + legend (brown, green, gray, blue). Slide 2: identical chart + two gender silhouettes (female and male) + descriptive text areas per silhouette. Total 2 slides, 16:9 widescreen format, PPTX file.
Related Products
-

Customer Analysis Diagram & Segmentation Graph – In-depth Market Insights
#Market and Competitor Analysis #Graph #Customer Analysis
-

Pork Consumption Stack Chart – Market Trend Analysis
#Market and Competitor Analysis #Graph #Market Analysis
-

User Gender Ratio Analysis Graph – Essential Tool for Market and Customer Analysis
#Market and Competitor Analysis #Graph #Other
-

Orange Hexagon Presentation Template Segmented Vertical Bar Graph – Market and Competitive Analysis
#Market and Competitor Analysis #Graph #Other
