Leather Material Presentation Template Table Chart – Financial Performance Visualization
RJ0200021_17
- Last Update 04/03/2025
- File Size 6.1MB
- # of Slides 2
- File Format PPTX
- Slide Ratio 16:9
- Color
Keywords
- #Content-Based Slides
- #Design-Based Slides
- #Financial Plans and Performance
- #Diagram
- #Income Statement
- #Key Financial Indicators
- #Table
- #Standard Table
- #16:9
- #table chart PowerPoint
- #financial data table presentation
- #leather texture slide
- #performance visualization PPT
- #table slide template download
About the Product
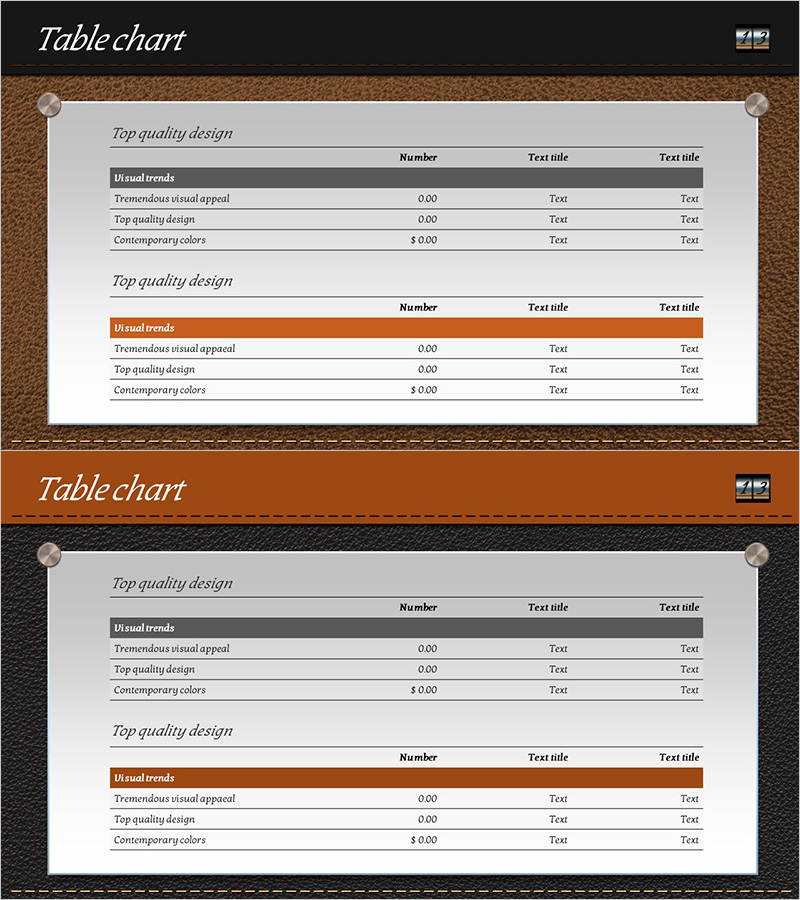
A professional PowerPoint slide featuring a 3-row table structure on a brown leather-textured background for presenting financial data and performance metrics. The 2-slide set includes the first slide with a gray header row and the second with an orange header row, providing visual variety. Each table is organized with three columns—item name, number, and text title—enabling clear presentation of revenue figures, profit margins, cost analysis, and budget allocations. Instantly applicable to financial sections, performance reports, budget reviews, and data-driven decision-making presentations.
Usage Points
-
Main Usage
Designed to organize and visualize key financial metrics, sales performance, cost analysis, and budget figures in a structured table format. The brown leather-textured background conveys professionalism and credibility, making it ideal for executive briefings, investor presentations, financial analysis reports, and quarterly earnings calls.
-
How to Use
Enter financial line items (e.g., Revenue, Operating Income, Net Profit) in the first column and corresponding figures in the number column. Arrange the two slides sequentially to compare quarterly results, year-over-year trends, or departmental performance. Use the header color differentiation (gray and orange) to segment sections and establish clear information hierarchy.
-
Recommended For
CFOs, financial analysts, business managers, investment relations professionals, management consultants, and data-driven decision makers. Ideal for quarterly earnings presentations, annual financial reports, budget review meetings, investor pitch decks, and corporate performance dashboards.
-
Slide Structure
2-slide set with brown leather-textured background. Each slide contains a 3-row table with 3 columns (including header). First slide features gray header row; second slide features orange header row. Editable fields for item names, numerical values, and descriptive text titles.
Related Products
-

Key Financial Indicators Table – Effective Data Presentation
#Financial Plans and Performance #Diagram #Income Statement
-

Key Financial Indicators Table – Clear Profit Analysis
#Financial Plans and Performance #Diagram #Income Statement
-

Income Statement Table – Clearly Presenting Financial Plans and Performance
#Financial Plans and Performance #Diagram #Income Statement
-

Premium Management Presentation Table – Efficient Financial Planning
#Financial Plans and Performance #Diagram #Income Statement
