Premium Management Presentation Table – Efficient Financial Planning
RJ0200031_14
- Last Update 04/06/2025
- File Size 7.7MB
- # of Slides 2
- File Format PPTX
- Slide Ratio 16:9
- Color
Keywords
- #Content-Based Slides
- #Design-Based Slides
- #Financial Plans and Performance
- #Diagram
- #Income Statement
- #Key Financial Indicators
- #Table
- #Standard Table
- #16:9
- #table matrix chart PowerPoint
- #data comparison slide template
- #financial table presentation
- #6-row 3-column table PPT
- #business data visualization PowerPoint
About the Product
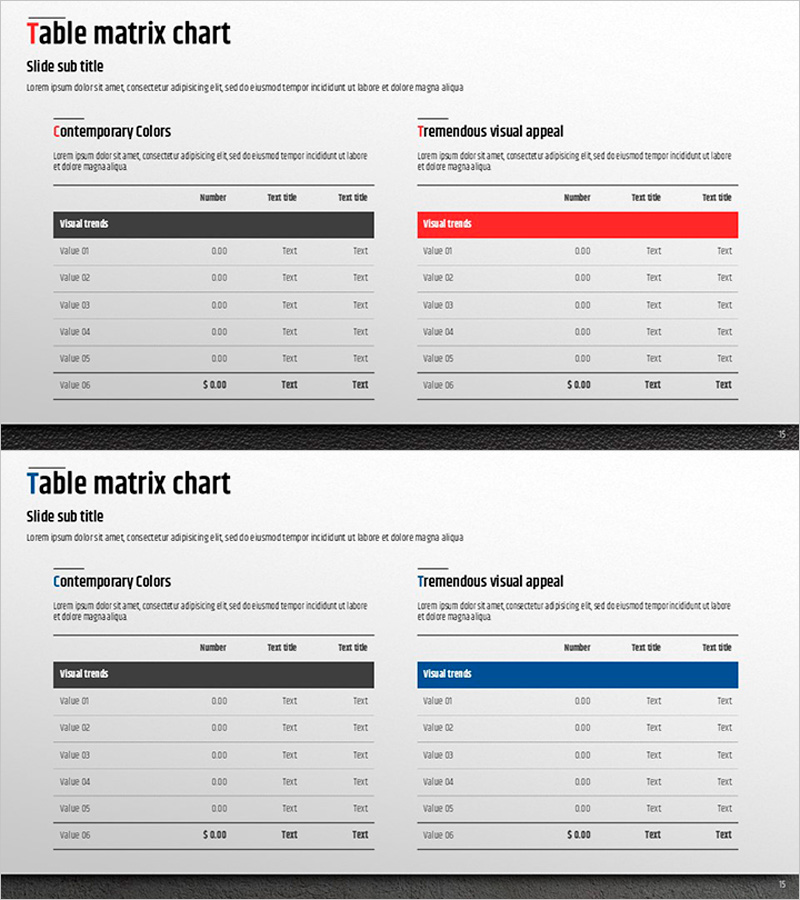
A professional table matrix chart PowerPoint slide designed for financial planning and performance analysis presentations. This 2-slide set features a contemporary dark gray header table on the left and a striking red header table on the right, each with 6 rows (Value 01 through Value 06) and 3 columns (Number, Text title, Text title). The dual-design approach allows you to present numerical data, financial figures, and descriptive text simultaneously while maintaining visual consistency. Ideal for income statements, financial reports, quarterly performance reviews, and business analysis decks that require clear data comparison and structured information layout.
Usage Points
-
Main Usage
Present financial metrics, performance indicators, cost breakdowns, and comparative data in a structured matrix format for quick analysis and decision-making. Optimized for income statements, budget summaries, quarterly results, and financial forecasts.
-
How to Use
Input numerical values, currency amounts, and descriptive text into each cell. Choose between the dark gray or red header version based on your presentation tone and brand guidelines. Use in financial reports, board meetings, investor presentations, and performance review sessions.
-
Recommended For
CFOs, financial analysts, business managers, consultants, and executives who present quantitative data-driven insights. Suitable for quarterly earnings calls, budget planning meetings, investor relations presentations, and internal performance evaluations.
-
Slide Structure
2-slide deck with identical 6-row 3-column table layouts. Slide 1 features a dark gray header (Contemporary Colors theme) for neutral, professional presentation. Slide 2 uses a bold red header (Tremendous visual appeal theme) for emphasis and visual impact. Each table includes labeled rows (Value 01–06) and three columns for flexible data input across numerical, financial, and text information.
Related Products
-

Table Chart of Point Frames – Profit and Loss Statement and Key Financial Metrics
#Financial Plans and Performance #Diagram #Income Statement
-

Income Statement Table for Financial Visualization – Distinct Data Analysis
#Financial Plans and Performance #Diagram #Income Statement
-

Visualizing Financial Performance with Business Table Chart – Intuitive and Effective
#Financial Plans and Performance #Diagram #Income Statement
-

Income Statement Table for Visualizing Financial Performance - Insights Navigator
#Financial Plans and Performance #Diagram #Income Statement
