Sales and Profit Chart by Year – Effective Financial Analysis
RJ0300041_19
- Last Update 04/28/2025
- File Size 1.2MB
- # of Slides 2
- File Format PPTX
- Slide Ratio 16:9
- Color
Keywords
- #Content-Based Slides
- #Design-Based Slides
- #Market and Competitor Analysis
- #Financial Plans and Performance
- #Diagram
- #Graph
- #Market Analysis
- #Sales and Revenue
- #Table
- #Other
- #Standard Table
- #Area Chart
- #16:9
- #area chart PowerPoint slide
- #annual sales trend chart
- #financial analysis presentation
- #multi-series area graph
- #revenue trend PowerPoint template
- #how to create area chart in PowerPoint
About the Product
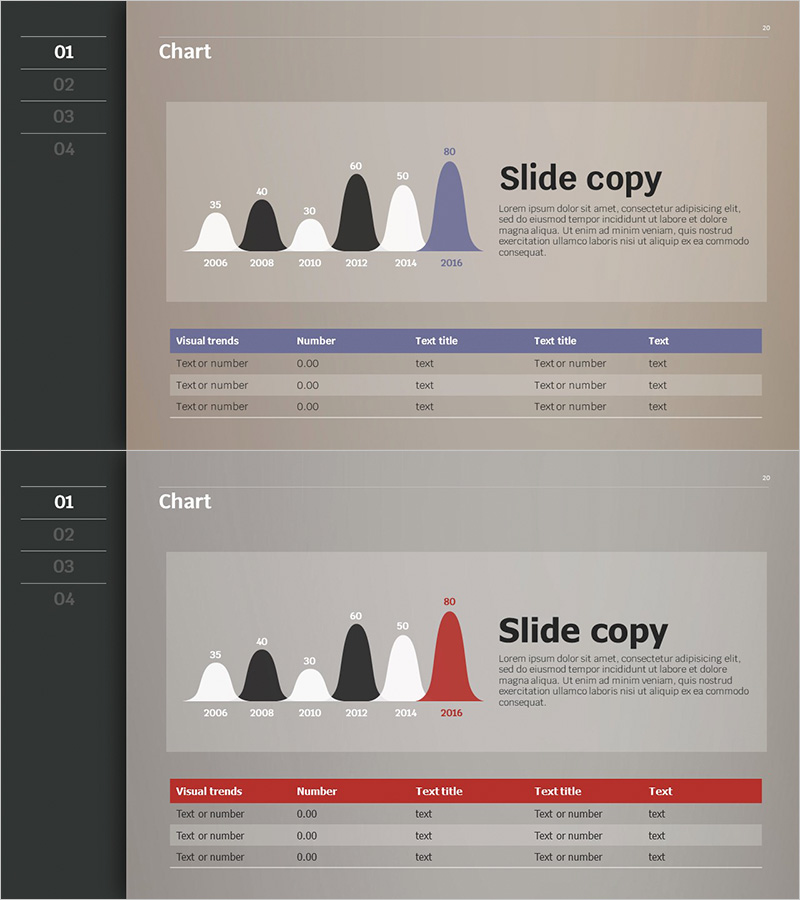
An area chart PowerPoint slide that visualizes annual sales and profit trends from 2006 to 2016 across six data series. Each area is represented with distinct colors (white, black, gray, blue) using smooth curves, making trend comparison intuitive and professional. Provided in 16:9 widescreen PPTX format, this slide is ready for financial reports, business analysis presentations, and executive briefings. A data table below the chart allows easy input of actual figures for immediate use in your presentation.
Usage Points
-
Main Usage
Display long-term sales and profit trends across multiple years while comparing several data series simultaneously. The stacked area format conveys both total scale and individual contribution of each series in a single visual.
-
How to Use
Ideal for financial performance sections in annual reports, quarterly earnings presentations to executives, investor relations meetings, and business plan reviews. Simply replace the sample data with your actual figures to create a professional presentation-ready slide.
-
Recommended For
CFOs, financial analysts, business managers, executives, and marketing leaders presenting performance metrics and multi-year trend analysis. Recommended for annual reports, quarterly reviews, investor presentations, and strategic business planning sessions.
-
Slide Structure
Upper area chart displays 10 years of data (2006–2016) across 6 series with smooth curves and color-coded areas. Lower data table features 5 rows × 5 columns with header row highlighted in blue and red, allowing input of year, values, titles, and descriptions.
Related Products
-

Table Slide for Garden Industry Status Analysis
#Market and Competitor Analysis #Financial Plans and Performance #Diagram
-

Market Analysis Graphs & Tables – Visualizing Sales Growth
#Market and Competitor Analysis #Financial Plans and Performance #Diagram
-

Sales and Profit Table – Visualizing Financial Performance
#Market and Competitor Analysis #Financial Plans and Performance #Diagram
-

Visualize Market Trends and Cash Flow with Area Charts!
#Market and Competitor Analysis #Financial Plans and Performance #Graph
