Renewable Energy Market Analysis Horizontal Bar Chart – Successful Strategies for Carbon Neutrality
RJ0600048_12
- Last Update 07/03/2025
- File Size 1.8MB
- # of Slides 2
- File Format PPTX
- Slide Ratio 16:9
- Color
Keywords
- #Content-Based Slides
- #Design-Based Slides
- #Market and Competitor Analysis
- #Financial Plans and Performance
- #Corporate Social Responsibility
- #Graph
- #Market Analysis
- #Sales and Revenue
- #ESG
- #Column
- #Column Chart
- #16:9
- #horizontal bar chart PowerPoint
- #market analysis slide template
- #renewable energy chart
- #dual-series comparison graph
- #positive negative bar chart
About the Product
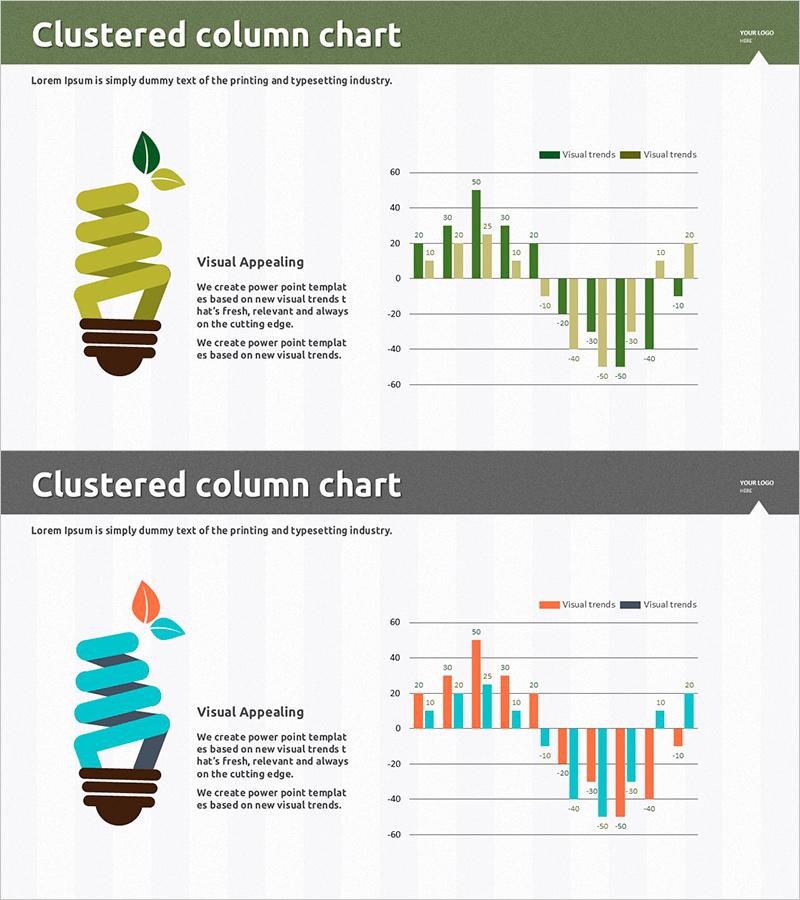
A horizontal bar chart PowerPoint slide designed for renewable energy market analysis presentations. The slide features a dual-series comparison in green and yellow tones, enabling simultaneous visualization of positive and negative values. A plant illustration on the left emphasizes environmental and sustainability themes, while the right side displays numerical data clearly. This 16:9 widescreen 2-slide set is ready to use for market overview presentations, carbon neutrality strategy discussions, renewable energy adoption impact analysis, and similar business contexts.
Usage Points
-
Main Usage
Communicate numerical market data—such as market size, growth rates, and regional comparisons—in renewable energy, environmental, and energy policy presentations through intuitive chart visualization. The dual-axis design clearly shows upward and downward trends.
-
How to Use
Insert the 2-slide set sequentially into your market analysis section. The left illustration serves as thematic emphasis; edit the right chart area with actual data values and legend labels. During presentation, explain each series trend to enhance audience comprehension.
-
Recommended For
Energy and environmental professionals, sustainability report authors, market analysts, carbon neutrality strategy teams, financial and investment meeting facilitators, and policy makers presenting renewable energy initiatives.
-
Slide Structure
2-slide layout. Each slide combines left-side plant illustration (green and yellow tones) with right-side horizontal bar chart (dual-series, approximately 8–10 data points, mixed positive/negative values). Includes title, legend, and gridlines.
Related Products
-

Geometry PPT Template Wide Vertical Bar Chart – Market Analysis Tool
#Market and Competitor Analysis #Financial Plans and Performance #Graph
-

Business Plan Presentation Template - World Wide Map
#Market and Competitor Analysis #Financial Plans and Performance #Graph
-

Market Sales and Profit Analysis with Bar Chart – Analysis and Insights
#Market and Competitor Analysis #Financial Plans and Performance #Graph
-

Market Analysis Graphs & Tables – Visualizing Sales Growth
#Market and Competitor Analysis #Financial Plans and Performance #Diagram
