Visualizing Business Strategies with Tables & Charts – Clear Data Presentation
RJ0200032_7
- Last Update 04/07/2025
- File Size 0.5MB
- # of Slides 2
- File Format PPTX
- Slide Ratio 16:9
- Color
Keywords
- #Content-Based Slides
- #Design-Based Slides
- #Business Strategy
- #Financial Plans and Performance
- #Diagram
- #Graph
- #Sales and Revenue
- #Table
- #Column
- #Standard Table
- #Column Chart
- #Project Progress
- #16:9
- #bar chart PowerPoint slide
- #data table template
- #business progress visualization
- #financial report slide
- #year-over-year growth chart PowerPoint
About the Product
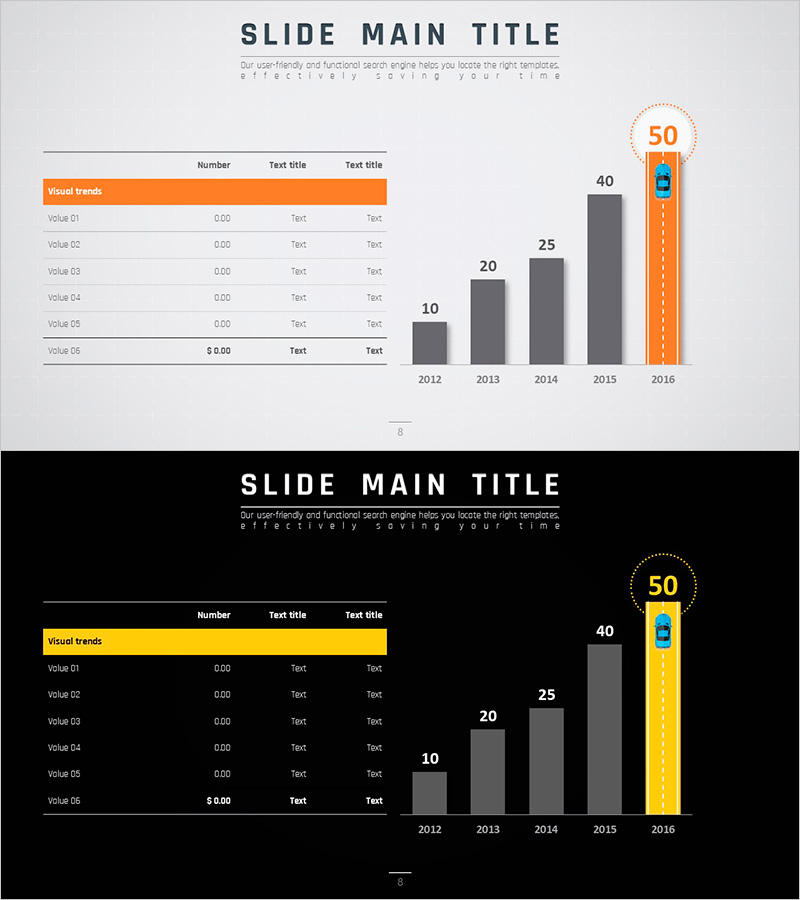
A 2-slide PowerPoint presentation set designed to clearly communicate business progress and performance metrics. The slides feature a horizontal bar chart displaying year-over-year growth data from 2012 to 2016, paired with a detailed data table on the left side. Key figures are highlighted in orange to draw attention, while the gray background and minimalist layout maximize data readability. Immediately applicable to financial reports, business performance presentations, investor pitch decks, and quarterly reviews where quantitative results need to be emphasized.
Usage Points
-
Main Usage
Visualizes time-series data such as annual growth trends, sales volume changes, and performance metrics to objectively demonstrate business achievements. The bar heights enable intuitive numerical comparison, while the table provides precise figures to strengthen credibility and stakeholder confidence.
-
How to Use
Apply to financial report performance sections, business achievement presentations, investor pitch decks, and quarterly performance reviews. Simply replace table values with actual data and adjust bar heights proportionally for immediate use in presentations.
-
Recommended For
CFOs, finance managers, business operations directors, executive reporting teams, and investor relations professionals who need to present quantitative results persuasively. Particularly effective for annual performance presentations, quarterly reviews, and investor meetings.
-
Slide Structure
Title area at top, 6-row data table on left (1 header row + 5 data rows, 3-column layout), 5-bar horizontal chart on right (2012–2016 years, peak value 50 highlighted). Table header and highest bar both use orange accent color for visual consistency.
Related Products
-

Color-highlighted Bar Graphs and Tables – Optimized for Financial Analysis
#Financial Plans and Performance #Diagram #Graph
-

Modern Wide PowerPoint Template Bar chart&Table
#Business Introduction #Financial Plans and Performance #Diagram
-

Typographic Wide Template Bar Chart & Table – Competitive Analysis and Performance
#Market and Competitor Analysis #Financial Plans and Performance #Diagram
-

Market Analysis Graphs & Tables – Visualizing Sales Growth
#Market and Competitor Analysis #Financial Plans and Performance #Diagram
