Colorless Bar Segmentation Graph – Market Analysis and Competitive Research
RJ0300042_12
- Last Update 04/29/2025
- File Size 0.3MB
- # of Slides 2
- File Format PPTX
- Slide Ratio 16:9
- Color
Keywords
- #Content-Based Slides
- #Design-Based Slides
- #Market and Competitor Analysis
- #Graph
- #Market Analysis
- #Horizontal Bar
- #Segmented Horizontal Bar
- #16:9
- #horizontal bar chart PowerPoint
- #segmented chart template
- #data comparison slide
- #monochrome graph design
- #market analysis PPT slide
- #competitive analysis chart PowerPoint
About the Product
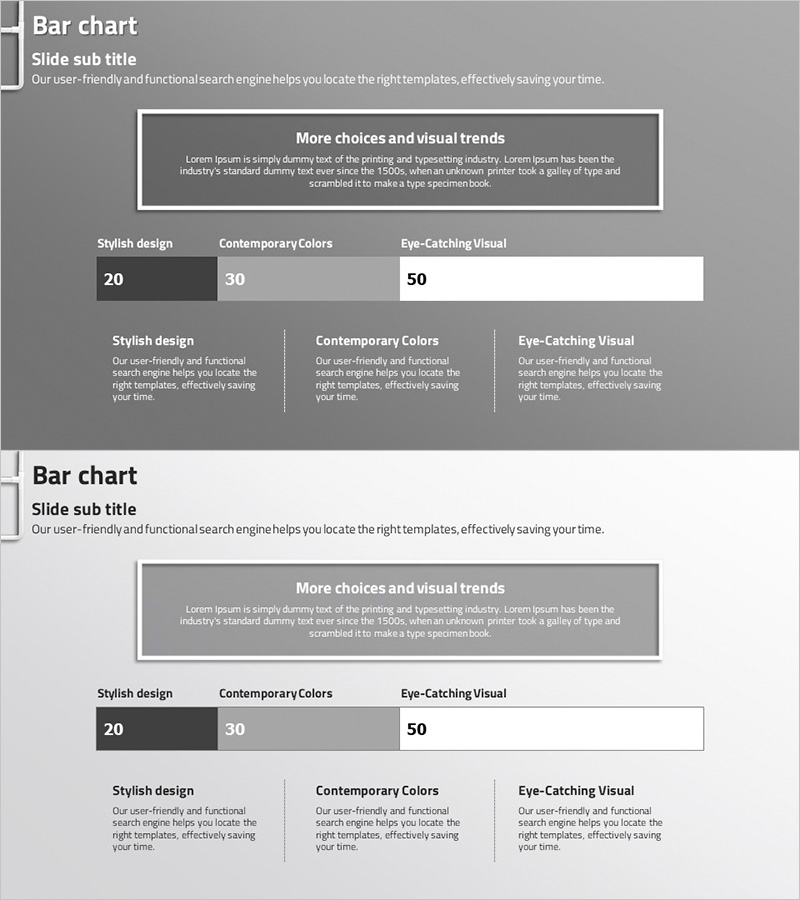
A horizontal bar segmentation chart PowerPoint slide optimized for market analysis and competitive research presentations. The monochrome color scheme uses dark gray, light gray, and white to divide each item into three segments, enabling clear data comparison. The 2-slide set includes identical layouts for visualizing multiple metrics simultaneously. Ideal for presentations, reports, and business proposals where numerical comparison and compositional ratios need to be communicated effectively.
Usage Points
-
Main Usage
Compares multiple items' compositional ratios and numerical values simultaneously. Each item is divided into three segments to display detailed data clearly, while the monochrome palette conveys professional analytical credibility.
-
How to Use
Apply to market share analysis, competitor benchmarking, budget allocation, and performance evaluation slides. Modify segment colors to represent different data categories and update text labels to match your presentation context.
-
Recommended For
Executives, analysts, marketing teams, and strategic planners presenting quantitative data. Effective for business plans, quarterly reports, competitive analysis documents, and investment proposals emphasizing objective numerical comparisons.
-
Slide Structure
2-slide set. Each slide contains 3 horizontal bar charts, with each bar divided into three segments: dark gray, light gray, and white. Title area at top, legend and description text area at bottom for clear data labeling.
Related Products
-

Market Entry Potential and Expansion Strategy Chart
#Market and Competitor Analysis #Graph #Market Status
-

Soccer Match Analysis Chart – Performance Analysis and Future Forecast
#Business Vision and Strategy #Market and Competitor Analysis #Graph
-

Target Country Analysis Chart – Data Visualization for Market Analysis
#Market and Competitor Analysis #Graph #Other
-

Segmented Bar Graph for Market Analysis Visualization
#Market and Competitor Analysis #Graph #Market Analysis
