Zombie Walking Dead Slide – Optimized for Competitor Analysis with Doughnut Chart
RJ0600039_14
- Last Update 07/01/2025
- File Size 2.7MB
- # of Slides 2
- File Format PPTX
- Slide Ratio 16:9
- Color
Keywords
- #Content-Based Slides
- #Design-Based Slides
- #Market and Competitor Analysis
- #Graph
- #Other
- #Competitor Analysis
- #Competitive Advantage
- #Circles
- #Doughnut Chart
- #Silhouette
- #16:9
- #zombie silhouette PowerPoint
- #doughnut chart slide template
- #comparison analysis presentation
- #competitive analysis slide
- #2-stage chart design
About the Product
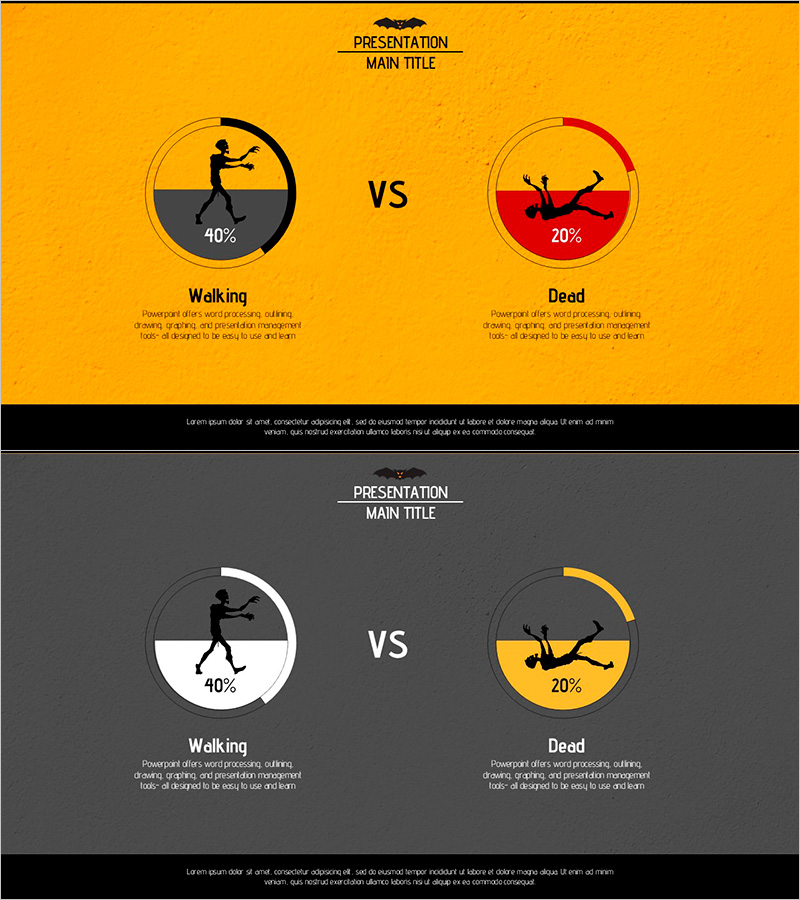
A 2-slide PowerPoint presentation designed for competitive analysis and comparison visualization. Zombie silhouettes represent Walking (40%) and Dead (20%) states displayed in doughnut chart format. The design combines a vibrant orange background with black and red accent colors to maximize contrast and visual impact. Created in 16:9 widescreen format for modern presentation environments. Fully editable slides ready for immediate use in business presentations, strategy comparisons, performance benchmarking, and market analysis reports.
Usage Points
-
Main Usage
Optimized for competitive analysis, performance comparison, and contrast visualization. The unique zombie silhouette visual captures audience attention while doughnut charts clearly compare two metrics side-by-side. Ideal for marketing strategy presentations, product performance comparisons, market share analysis, and competitive positioning reports.
-
How to Use
Edit the doughnut chart percentages (40%, 20%) with your actual data and replace Walking/Dead labels with your comparison categories. Maintain the orange background and color accents, or adjust to match corporate brand colors. Add analysis text in the description areas below each chart to complete the slide.
-
Recommended For
Marketing teams presenting competitive analysis, sales teams comparing product features, executive reports showing performance metrics, strategy meetings analyzing market data. Particularly effective when clearly contrasting two competing options or outcomes.
-
Slide Structure
Two-slide layout with each slide featuring two circular doughnut charts in VS arrangement. Each doughnut contains a silhouette icon and percentage value. Item labels and description text areas are positioned below. First slide uses orange background; second slide features dark gray background for design variation.
Related Products
-

Banking Services Sector Analysis Graph – Market and Competitor Analysis
#Market and Competitor Analysis #Graph #Competitor Analysis
-

Doughnut Chart Presentation for Pet Store Competitor Analysis
#Market and Competitor Analysis #Graph #Competitor Analysis
-

Vertical Bar Chart Slide for Business Competitive Advantage Analysis
#Market and Competitor Analysis #Graph #Other
-

Dental Caries Treatment Analysis Donut Circle Graph – A Clear Competitive Edge
#Market and Competitor Analysis #Diagram #Graph
