Eco-Friendly Business Goal Market Strategy Horizontal Bar Chart
RJ0600051_12
- Last Update 07/04/2025
- File Size 8.1MB
- # of Slides 2
- File Format PPTX
- Slide Ratio 16:9
- Color
Keywords
- #Content-Based Slides
- #Design-Based Slides
- #Market and Competitor Analysis
- #Graph
- #Competitor Analysis
- #Competitive Advantage
- #Horizontal Bar
- #Double Horizontal Bar
- #16:9
- #horizontal bar chart PowerPoint
- #bar graph slide template
- #data comparison presentation
- #eco-friendly business PPT
- #market strategy chart template
About the Product
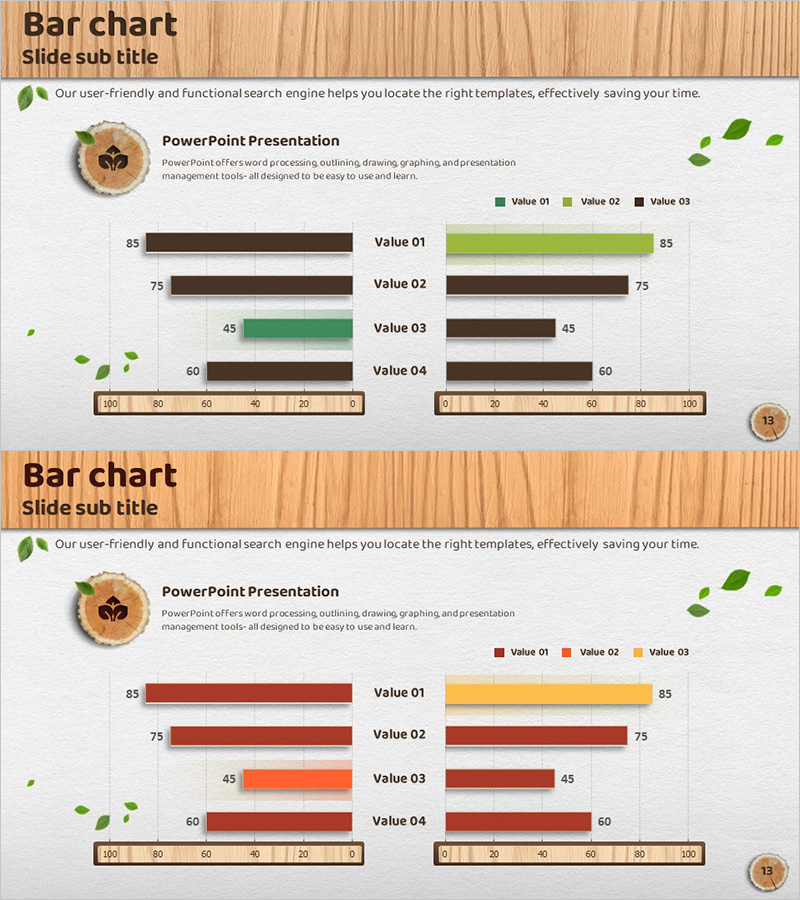
A horizontal bar chart PowerPoint slide optimized for eco-friendly business strategy presentations. The 2-slide set features a left slide with brown and green color series comparing 4 items across 3 data values, and a right slide with orange and red tones displaying the same structure for scenario-based comparative analysis. Wood texture background and leaf illustrations reinforce the eco-friendly brand image, while numeric labels beside each bar and bottom scale ensure accurate data interpretation. Ready-to-use for market strategy, competitive analysis, and goal achievement comparison presentations.
Usage Points
-
Main Usage
Visualizes quantitative data in a left-right comparison structure, enabling simultaneous analysis of two scenarios, strategies, or competitor performance. Eco-friendly design elements suit sustainability and ESG management presentations, while 4-item numeric comparison provides clear decision-making evidence.
-
How to Use
Bar length and color intuitively convey data magnitude and series differentiation, with numeric labels ensuring precision. Left slide represents baseline scenario, right slide represents alternative scenario, allowing selective use based on presentation flow. Background texture and leaf decorations maintain consistent eco-friendly theme throughout.
-
Recommended For
Recommended for executive and strategy team business presentations, investor performance reports, competitive analysis materials, and eco-friendly or ESG business plan sections. Delivers high-credibility data visualization for any business presentation requiring quantitative comparison.
-
Slide Structure
2-slide set. Each slide displays 4 items (Value 01–04) as horizontal bars with 3 data series (Value 01, 02, 03) color-coded. Left slide uses brown and green tones; right slide uses orange and red tones. Numeric labels appear right of each bar, with 0–100 scale at bottom.
Related Products
-

Business Analysis Bilinear Bar Graph
#Market and Competitor Analysis #Graph #Competitor Analysis
-

Horizontal Bar Graph for Cooking Competition
#Market and Competitor Analysis #Graph #Competitor Analysis
-

Bar Graph for Competitor Analysis – Business Advantage
#Market and Competitor Analysis #Graph #Competitor Analysis
-

Competitive Comparison Analysis Bar Graph – Visualizing Market Advantage
#Market and Competitor Analysis #Graph #Competitor Analysis
