Graphs of Warring States – Capturing Competitive Advantages
RJ0600056_5
- Last Update 07/05/2025
- File Size 3.2MB
- # of Slides 2
- File Format PPTX
- Slide Ratio 16:9
- Color
Keywords
- #Content-Based Slides
- #Design-Based Slides
- #Market and Competitor Analysis
- #Graph
- #Competitor Analysis
- #Competitive Advantage
- #Column
- #Column Chart
- #16:9
- #clustered column chart PowerPoint
- #dual-series comparison slide
- #competitive analysis template
- #data comparison chart
- #how to create clustered chart in PowerPoint
About the Product
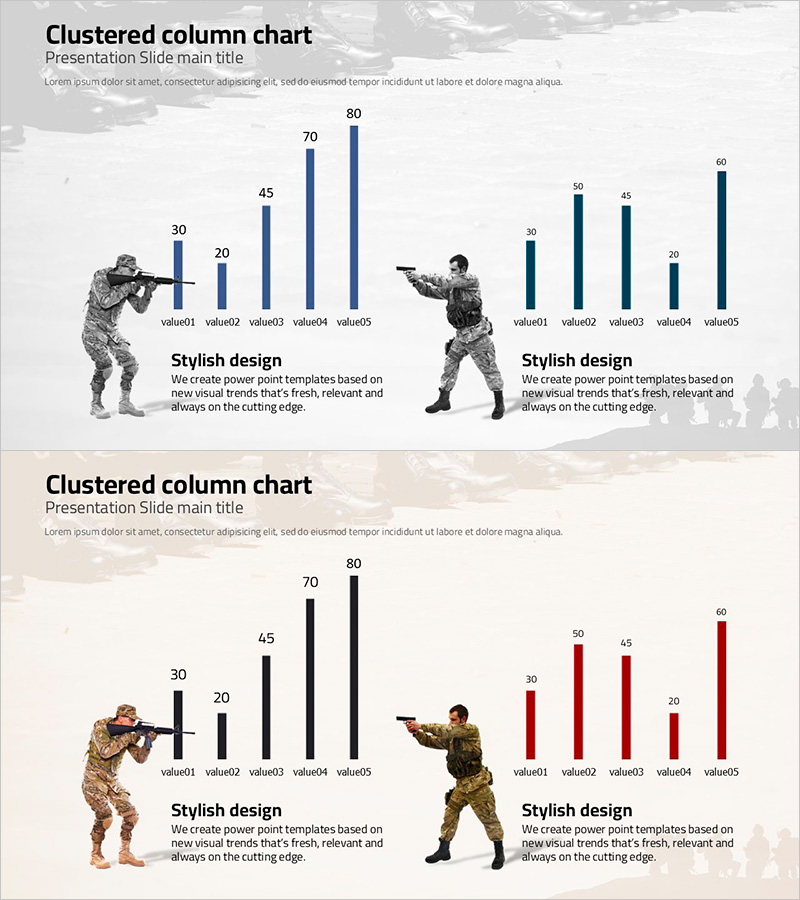
A clustered column chart PowerPoint slide that visualizes competitive advantage through side-by-side data comparison. This presentation template displays two data series across five items with soldier silhouette backgrounds emphasizing competition and strategy context. Available in three color combinations—gray, navy blue, and deep red—making it immediately applicable to corporate presentations, market analysis reports, and competitive benchmarking documents. The 2-slide set accommodates multiple data scenarios, optimized for 16:9 widescreen format and fully editable in PPTX.
Usage Points
-
Main Usage
This slide enables quantitative comparison of two data series side-by-side across five categories. It effectively contrasts market share, sales volume, customer satisfaction, and other performance metrics between competitors, serving as evidence-based support for competitive strategy discussions.
-
How to Use
Input numerical values for each item (value01–value05) and column heights adjust automatically. Color combinations (gray, navy, deep red) are fully editable to match corporate branding. Soldier silhouette backgrounds reinforce competition and strategy themes. Both slides share identical structure, allowing multiple data sets to be presented consistently.
-
Recommended For
Ideal for executive reports from strategy, marketing, and sales departments; investor presentations; market analysis reports; and competitive benchmarking sessions. Recommended for B2B presentations requiring quantitative comparative analysis and internal corporate meetings.
-
Slide Structure
Both slides feature identical layout: title area at top, clustered column chart in center (5 items × 2 series), descriptive text area at bottom. Soldier silhouettes on left and right sides emphasize competitive context. 16:9 widescreen ratio, PPTX format with all elements fully editable.
Related Products
-

Camera Comparison Competitive Analysis Slide - Data-Driven Strategy
#Market and Competitor Analysis #Graph #Competitor Analysis
-

Gradient Vertical Bar Chart – Suitable for Market and Competitive Analysis
#Market and Competitor Analysis #Graph #Competitor Analysis
-

Gradient PPT Wide Template Vertical Bar Comparison Graph
#Market and Competitor Analysis #Graph #Competitor Analysis
-

Data Analysis with Zombie Hand Graph Visualization
#Market and Competitor Analysis #Graph #Competitor Analysis
