Highlighted Broken Line Graph for Market Analysis Visualization
RJ0700014_9
- Last Update 07/26/2025
- File Size 0.3MB
- # of Slides 2
- File Format PPTX
- Slide Ratio 16:9
- Color
Keywords
About the Product
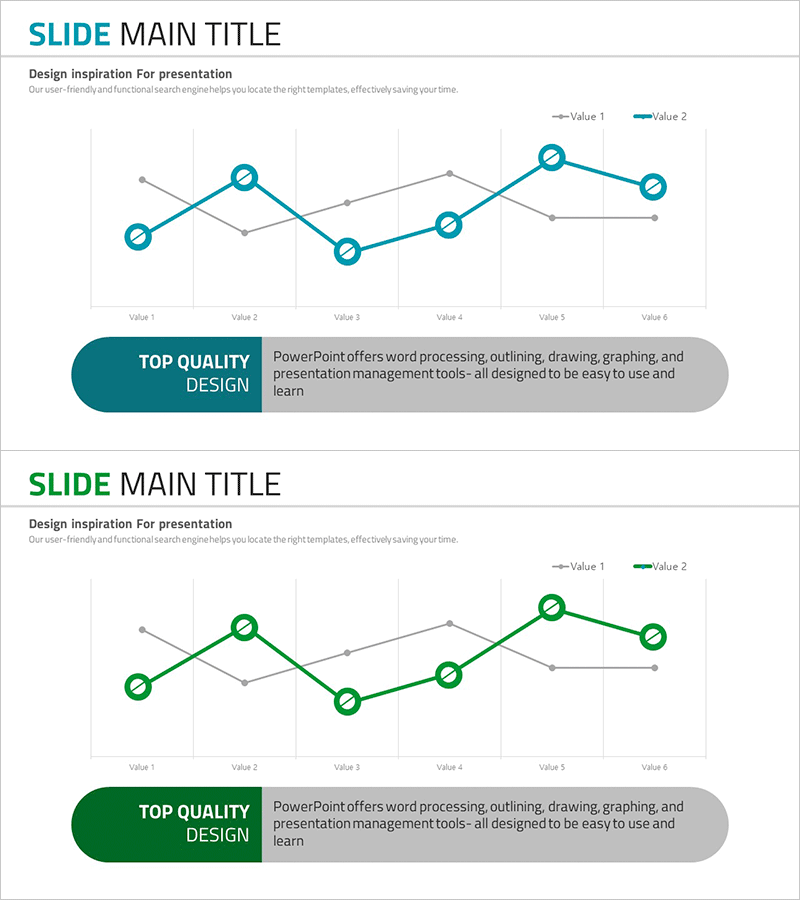
A dual-series line chart PowerPoint slide designed for market analysis and performance comparison. The slide visualizes two data series (Value 1 and Value 2) across six data points using teal and gray color schemes. Circular node markers emphasize each data point, while a grid background provides clear reference lines. A callout text box at the bottom highlights key insights or conclusions. This presentation template is ready to use in business reports, investor pitches, quarterly reviews, and strategic planning documents.
Usage Points
-
Main Usage
Ideal for comparing two variables over time, such as market trends, sales performance, customer satisfaction scores, or operational metrics. Effectively communicates data-driven insights in executive briefings, investor presentations, quarterly earnings reports, and strategic planning sessions.
-
How to Use
Replace the sample data (Value 1 and Value 2) with your actual figures. Each data point is an editable node that can be adjusted to match your data range. Customize the color scheme and axis labels to align with your brand guidelines. Update the callout box with your key findings or conclusions to direct audience attention.
-
Recommended For
Marketing managers, financial analysts, business planners, management consultants, and sales directors presenting performance metrics and trend analysis. Suitable for quarterly business reviews, competitive benchmarking, customer satisfaction tracking, revenue growth analysis, and operational performance dashboards.
-
Slide Structure
Two-slide set featuring teal and green accent variations. Each slide contains a dual-series line chart with 6 data points, legend (Value 1 and Value 2), gridlines, and a callout text box. Optimized for 16:9 widescreen format with fully editable elements for seamless customization.
Related Products
-

Competitor Analysis Broken Line Graph – Market Insights Provided
#Market and Competitor Analysis #Graph #Competitor Analysis
-

Competitor Technology Comparison Graph – Market and Competitor Analysis
#Market and Competitor Analysis #Graph #Competitor Analysis
-

Virus Analysis Broken Line Graph – Market and Competitor Analysis
#Market and Competitor Analysis #Graph #Competitor Analysis
-

Competitor Analysis Broken Line Graph
#Market and Competitor Analysis #Graph #Competitor Analysis
