3D Printing Market Analysis Graph
RJ0400036_30
- Last Update 05/27/2025
- File Size 0.3MB
- # of Slides 2
- File Format PPTX
- Slide Ratio 16:9
- Color
Keywords
- #Content-Based Slides
- #Design-Based Slides
- #Market and Competitor Analysis
- #Diagram
- #Graph
- #Competitor Analysis
- #Market Analysis
- #Table
- #Column
- #Standard Table
- #Grouped Column
- #16:9
- #vertical column chart PowerPoint
- #bar chart slide template
- #data comparison graph
- #market analysis chart
- #how to create column chart in PowerPoint
About the Product
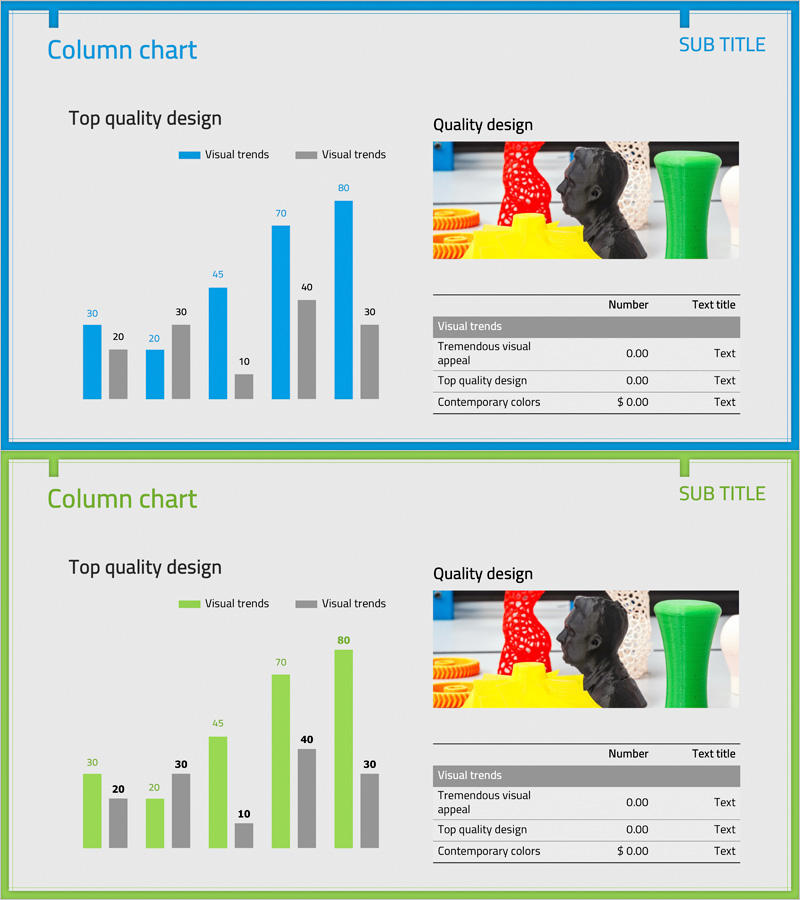
A vertical column chart PowerPoint slide designed for 3D printing market analysis presentations. The slide features dual-series data visualization with blue and gray bars, enabling clear comparison of up to eight data points with values reaching 80. The left section displays the column chart, while the right side combines product imagery with a detailed information table. This presentation slide effectively communicates market size, competitive benchmarking, performance metrics, and analytical insights in business reports, proposals, and strategic presentations.
Usage Points
-
Main Usage
Ideal for comparing market metrics, competitive performance, sales volumes, and customer satisfaction across multiple categories. The combined chart and information table layout allows simultaneous presentation of visual data trends and detailed numerical context.
-
How to Use
Input actual data values into the left column chart and populate the right information table with item names, numerical values, and descriptions. Use the blue series for primary metrics and gray series for comparative benchmarks to enhance clarity. Replace the product image area with relevant photographs or icons as needed.
-
Recommended For
Marketing teams presenting market analysis, sales teams delivering competitive benchmarking reports, executive presentations on performance metrics, investor relations materials, and product planning teams analyzing market conditions.
-
Slide Structure
Two-slide set. Title area at top, left section with vertical column chart (8 items, dual blue-gray series, maximum value 80), right upper section for product image, right lower section with information table (three columns: item name, numerical value, description). Optimized for 16:9 widescreen format.
Related Products
-

Competitor Comparison Analysis Graph - A Tool for Effective Market Analysis
#Market and Competitor Analysis #Diagram #Graph
-

Table Chart & Clustered Column Graph – Market and Competitor Analysis
#Market and Competitor Analysis #Diagram #Graph
-

Performance Analysis Table Slide – Market and Competitor Analysis
#Market and Competitor Analysis #Diagram #Graph
-

Note Illustration Theme Chart – Market Analysis and Competitor Insights Tool
#Market and Competitor Analysis #Diagram #Graph
