International Trade Market Analysis Graph – Visualizing Market Trends
RJ0300030_8
- Last Update 04/26/2025
- File Size 3.4MB
- # of Slides 2
- File Format PPTX
- Slide Ratio 16:9
- Color
Keywords
- #Content-Based Slides
- #Design-Based Slides
- #Market and Competitor Analysis
- #Graph
- #Future Outlook
- #Market Analysis
- #Horizontal Bar
- #Segmented Horizontal Bar
- #16:9
- #horizontal bar chart PowerPoint
- #bar graph slide template
- #data comparison chart
- #market analysis graph
- #how to create bar chart in PowerPoint
About the Product
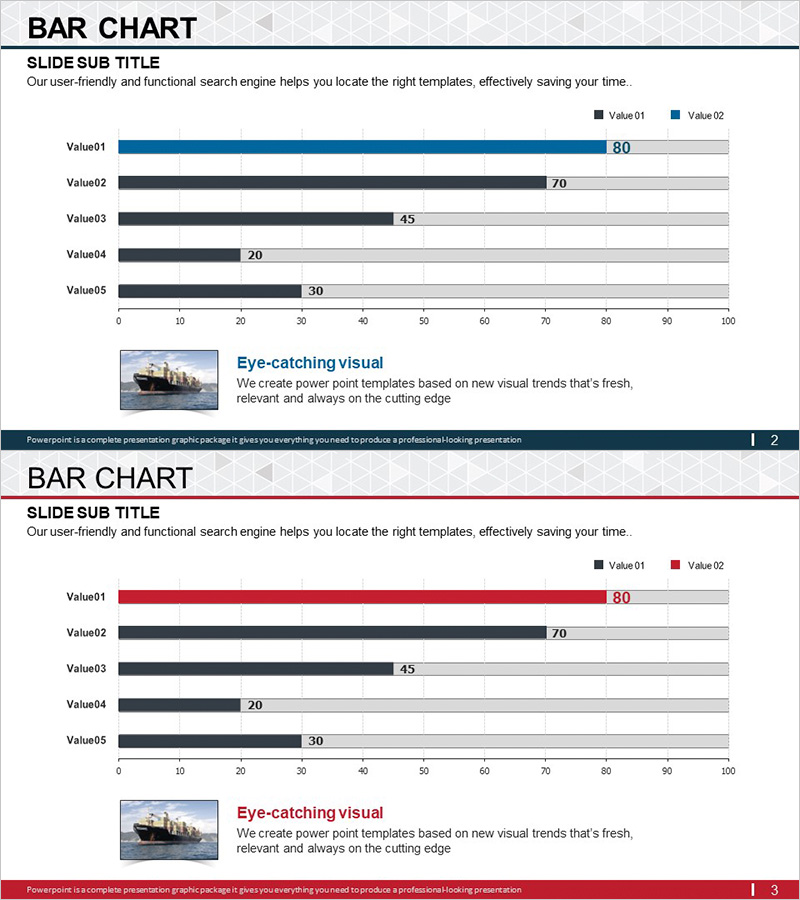
A horizontal bar chart PowerPoint slide designed for international trade market analysis and data comparison. This presentation template features five data items visualized with a navy, dark gray, and light gray color scheme that clearly distinguishes data hierarchy. Each bar displays numerical labels for precise value communication, with a balanced 0–100 scale layout suitable for market trends, sales performance, and comparative analysis. The 2-slide set includes a base version and an accent version, allowing you to select the appropriate design based on your presentation context. Fully editable for immediate use with your own data.
Usage Points
-
Main Usage
Optimized for comparing five numerical data items horizontally, such as international trade metrics, market analysis, sales performance, and competitive benchmarks. Bar length conveys relative magnitude intuitively, while numerical labels provide exact values simultaneously.
-
How to Use
Use in the market analysis, competitor comparison, or performance reporting sections of your presentation. Choose between the base version (navy accent) and the emphasis version (red accent) to highlight key items. Edit text and values directly to input your own data.
-
Recommended For
Ideal for executives, marketing teams, sales departments, finance teams, consultants, and research professionals presenting market trends, sales figures, cost comparisons, and performance metrics. Particularly suited for international trade, import/export, and global business reports and presentations.
-
Slide Structure
2-slide set: Slide 1 features navy accent version (Value01 top emphasis), Slide 2 features red accent version (Value01 top emphasis). Both slides display the same five items (Value01–Value05 with values 80, 70, 45, 20, 30). Each slide includes image, title, and description text areas at the bottom for additional information.
Related Products
-

Accumulated Graph of Sales Performance – Market Analysis Use
#Market and Competitor Analysis #Graph #Future Outlook
-

Positive Sales Revenue Analysis Graph – Visualizing Market Status
#Market and Competitor Analysis #Graph #Future Outlook
-

Trade Market Analysis Graph – Visualizing Market Status
#Market and Competitor Analysis #Graph #Market Status
-

Mobile Services Market Analysis Bar Graph
#Market and Competitor Analysis #Graph #Competitor Analysis
