Accumulated Graph of Sales Performance – Market Analysis Use
RJ0900027_21
- Last Update 08/24/2025
- File Size 1.3MB
- # of Slides 2
- File Format PPTX
- Slide Ratio 16:9
- Color
Keywords
- #Content-Based Slides
- #Design-Based Slides
- #Market and Competitor Analysis
- #Graph
- #Future Outlook
- #Market Analysis
- #Horizontal Bar
- #Segmented Horizontal Bar
- #16:9
- #horizontal bar chart PowerPoint
- #sales performance slide template
- #accumulated graph presentation
- #market analysis chart
- #data visualization slides
- #business report template download
About the Product
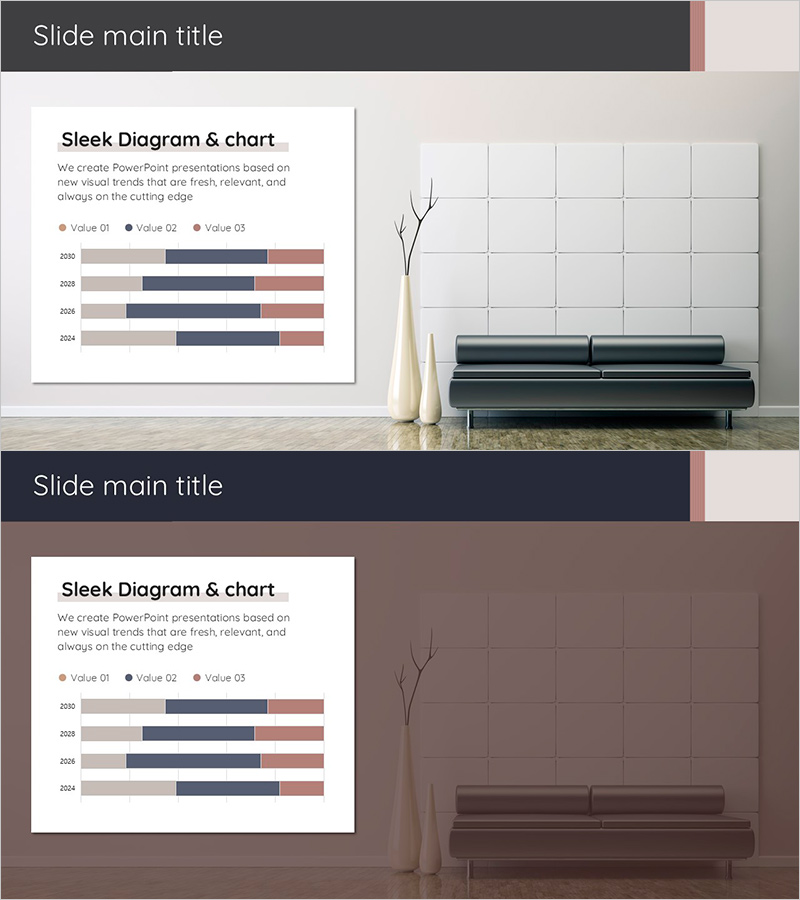
A PowerPoint slide featuring a horizontal bar chart that visualizes annual sales performance data from 2021 to 2024. The chart displays three data series (Value 01, 02, and 03) in a stacked format using a harmonious color palette of beige, navy, and terracotta. Designed specifically for market analysis and sales reporting presentations, this 16:9 widescreen slide deck contains 2 fully editable slides ready for immediate use in business presentations.
Usage Points
-
Main Usage
This slide effectively compares year-over-year sales performance trends and cumulative growth patterns. By displaying three data series simultaneously, it enables viewers to quickly assess relative values and identify performance changes, making it ideal for executive briefings, investor presentations, and market analysis reports.
-
How to Use
Sales, marketing, and management teams use this template for quarterly and annual performance reporting. Simply copy your data from Excel and paste it into the chart—the graph updates automatically. Colors and legend labels can be customized to match your company's branding guidelines.
-
Recommended For
Finance, accounting, management, and marketing professionals preparing executive reports, quarterly performance presentations, investor meetings, and market analysis documents. Particularly effective when comparing multiple data series across time periods.
-
Slide Structure
The 2-slide deck features horizontal bar charts displaying 4 years of data (2021–2024) across 3 distinct series. The legend is positioned at the top, with bars color-coded in beige, navy, and terracotta. The 16:9 aspect ratio ensures optimal display on modern presentation screens with clean, professional spacing.
Related Products
-

International Trade Market Analysis Graph – Visualizing Market Trends
#Market and Competitor Analysis #Graph #Future Outlook
-

Positive Sales Revenue Analysis Graph – Visualizing Market Status
#Market and Competitor Analysis #Graph #Future Outlook
-

Trend Color Wide Template - Segmentation Horizontal Bar Graph
#Company Introduction #Market and Competitor Analysis #Graph
-

100% Stacked Bar Chart Abstract Pattern Presentation
#Market and Competitor Analysis #Graph #Other
