Positive Sales Revenue Analysis Graph – Visualizing Market Status
RM0100009_10
- Last Update 01/27/2025
- File Size 0.8MB
- # of Slides 2
- File Format PPTX
- Slide Ratio 16:9
- Color
Keywords
- #Content-Based Slides
- #Design-Based Slides
- #Market and Competitor Analysis
- #Graph
- #Future Outlook
- #Market Analysis
- #Horizontal Bar
- #Segmented Horizontal Bar
- #16:9
- #sales revenue bar chart PowerPoint
- #financial analysis slide template
- #horizontal vertical bar graph
- #market status chart
- #data visualization slides
About the Product
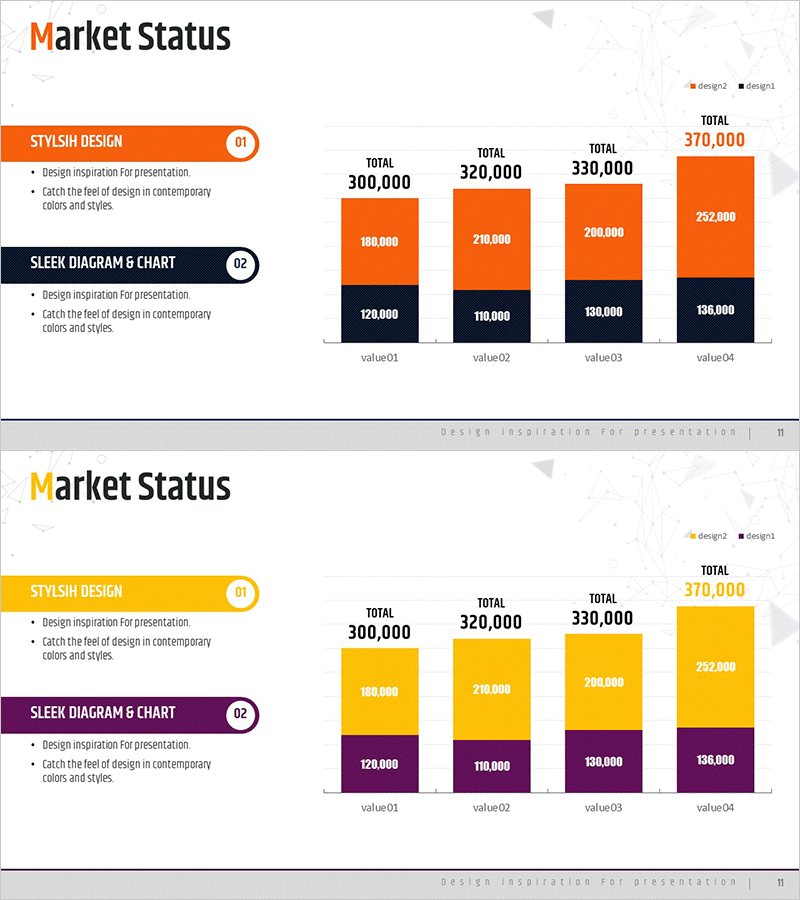
A PowerPoint slide set for visualizing market status and sales revenue analysis. This presentation template includes both horizontal and vertical bar chart formats in a single package, allowing you to select the appropriate layout based on your data comparison needs. The design features an orange and black two-tone color scheme with capacity for four data items on each slide. Ideal for business reports, sales presentations, marketing plans, and financial briefings where revenue trends and market share visualization are required.
Usage Points
-
Main Usage
Visualizes quarterly and annual sales trends, product revenue comparisons, market share analysis, and regional sales figures. The dual chart formats enable you to select the most effective representation method for your specific data characteristics.
-
How to Use
Insert into the performance analysis section of business reports, financial status slides for investor presentations, and market analysis pages of marketing plans. Simply edit the values and legend to input your actual data and the slide is ready for presentation.
-
Recommended For
Recommended for finance teams, marketing departments, and sales teams preparing periodic reports. Effective for quarterly performance briefings, executive presentations, and client proposal pitches where data-driven decision-making is essential.
-
Slide Structure
Two-slide set. First slide features a vertical bar chart (4-item comparison), second slide presents a horizontal bar chart (4-item comparison). Each slide uses orange (design2) and black (design1) legend categories with clearly marked data labels and numeric input areas for easy customization.
Related Products
-

International Trade Market Analysis Graph – Visualizing Market Trends
#Market and Competitor Analysis #Graph #Future Outlook
-

Accumulated Graph of Sales Performance – Market Analysis Use
#Market and Competitor Analysis #Graph #Future Outlook
-

Segmented Horizontal Bar Graph for Market Overview – Five Color Template
#Market and Competitor Analysis #Graph #Market Status
-

Segmented Bar Graph for Market Competition Analysis – Data-Driven Insights
#Market and Competitor Analysis #Graph #Market Analysis
