Children's Competency Analysis Chart – Competitive Market Analysis
RJ0500036_13
- Last Update 06/16/2025
- File Size 0.8MB
- # of Slides 2
- File Format PPTX
- Slide Ratio 16:9
- Color
Keywords
About the Product
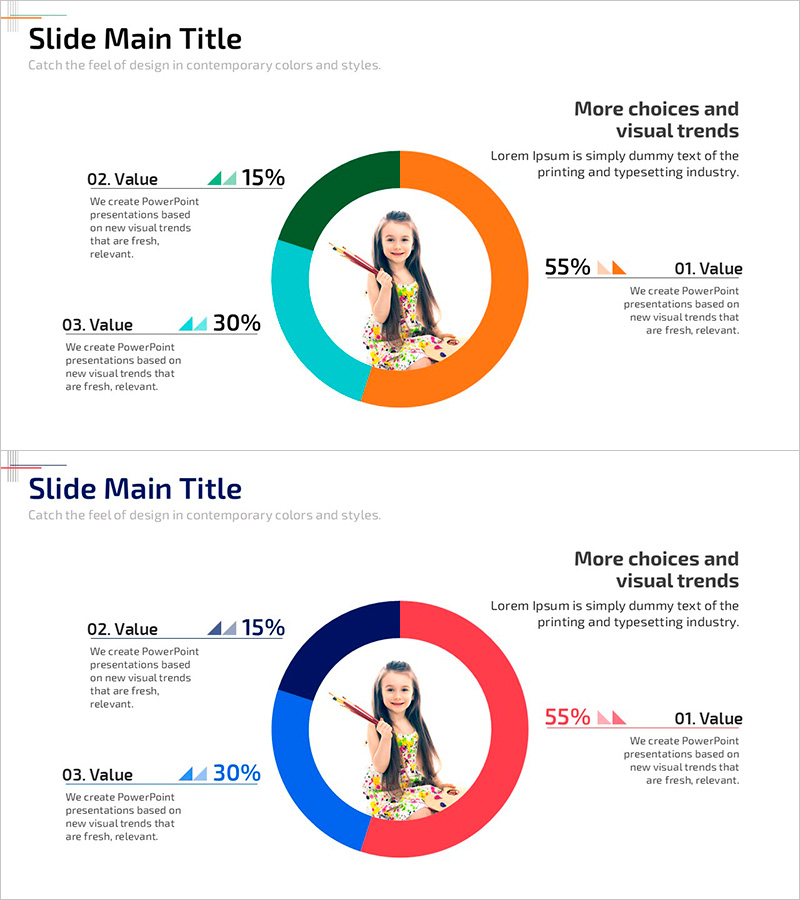
A PowerPoint slide featuring a 3-segment donut chart that visualizes proportional data with green, orange, and teal color segments. The design combines a central image area with left-aligned text fields for percentage values and descriptions, making it ideal for competency analysis, market share analysis, and customer segmentation presentations. The slide deck includes 2 slides in 16:9 widescreen format, fully editable in PPTX format for immediate customization and professional data visualization.
Usage Points
-
Main Usage
Display proportional relationships between three key metrics—such as organizational competencies, market share distribution, or customer demographics—using a visually clear donut chart format. The central image area emphasizes the topic with relevant photography or icons, while the left text section provides numerical values and contextual descriptions for each segment.
-
How to Use
Enter item names and percentages in the left '02. Value' and '03. Value' text boxes, then add supporting details in the right '01. Value' section. Customize the donut chart colors to match your organization's brand palette, or keep the existing green, orange, and teal scheme. Insert product photos, portraits, or relevant illustrations in the central image area to enhance visual impact and data comprehension.
-
Recommended For
Executive reports, marketing strategy presentations, market analysis briefings, organizational capability assessments, customer analysis documents, and product positioning pitches. Ideal for professionals in management, marketing, business planning, and data analytics roles who need to communicate data-driven insights effectively.
-
Slide Structure
2-slide deck with consistent layout: left text area (3 data entry fields), center donut chart (3 segments in green, orange, teal), and right image area (center-positioned). 16:9 widescreen aspect ratio optimized for modern monitors, projectors, and digital displays.
Related Products
-

Consumer Analysis Chart by Age Group – Market Share and Customer Analysis
#Market and Competitor Analysis #Graph #Customer Analysis
-

Customer Analysis Donut Chart - Visualizing Market Share
#Market and Competitor Analysis #Graph #Other
-

Visualizing Educational Insights from Surveys with Doughnut Chart
#Market and Competitor Analysis #Diagram #Graph
-

Wedding Cost Analysis - Donut Chart Data Visualization
#Market and Competitor Analysis #Graph #Customer Analysis
