Visualizing Educational Insights from Surveys with Doughnut Chart
RM0900012_8
- Last Update 03/04/2025
- File Size 6MB
- # of Slides 2
- File Format PPTX
- Slide Ratio 16:9
- Color
Keywords
- #Content-Based Slides
- #Design-Based Slides
- #Market and Competitor Analysis
- #Diagram
- #Graph
- #Customer Analysis
- #Market Share
- #Cluster
- #Circles
- #Chain Diagram
- #Doughnut Chart
- #16:9
- #doughnut chart PowerPoint
- #pie chart slide template
- #survey data visualization
- #5-segment donut chart
- #educational insights presentation
- #percentage data slide
About the Product
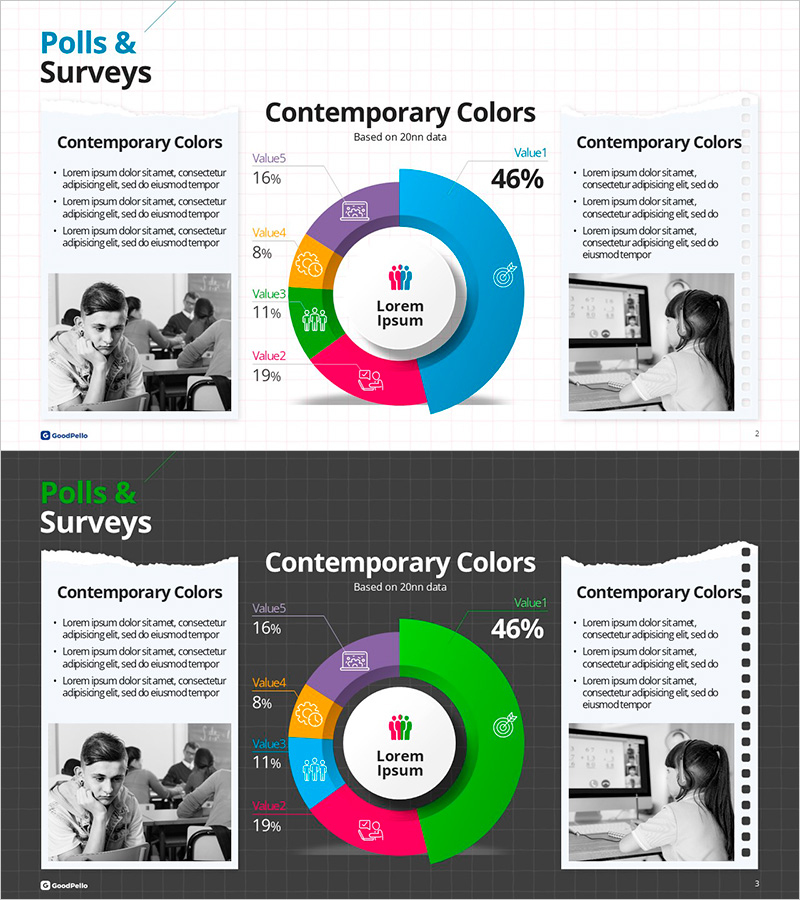
A PowerPoint slide featuring a 5-segment doughnut chart designed to visualize survey results and analytical data. The chart displays percentage values and labels for each segment, with a central icon area to highlight the main topic. Left and right text boxes accommodate supporting insights, while black-and-white photographs provide contextual visual reinforcement. The color palette includes blue, green, pink, orange, and purple segments on a light background, ensuring clear differentiation of each category. This 2-slide set is ready to use for educational insights, market analysis, and customer feedback presentations.
Usage Points
-
Main Usage
Visualize categorical data across five segments using a doughnut chart format. The central icon emphasizes the topic while percentage labels on each segment provide clear quantitative context, making complex survey results immediately comprehensible to audiences.
-
How to Use
Replace the text boxes with your survey context and key findings. Update the five data values and segment labels to match your dataset. Substitute the sample photographs with relevant images. Adjust colors if needed to match your brand guidelines.
-
Recommended For
Educational institutions presenting student satisfaction surveys, corporate market research reports, marketing teams analyzing customer demographics, HR departments sharing employee engagement results, and consulting firms presenting client insights.
-
Slide Structure
Central doughnut chart with 5 color-coded segments (blue 46%, pink 19%, green 11%, orange 8%, purple 16%) and icon placeholder. Two text boxes flank the chart on left and right, with two black-and-white photograph areas providing visual context and supporting narrative.
Related Products
-

Key Customer Segmentation Analysis Donut Chart
#Market and Competitor Analysis #Graph #Customer Analysis
-

Itinerary Doughnut Graph – Efficient Planning
#Business Management #Market and Competitor Analysis #Diagram
-

Status of Research and Development by Topic – Innovation and Trust
#Product/Service Introduction #Market and Competitor Analysis #Diagram
-

Development Status Analysis Connection Diagram – Effective Information Delivery
#Product/Service Introduction #Market and Competitor Analysis #Diagram
