Income Statement Table - Financial Performance Analysis
RJ0300030_11
- Last Update 04/26/2025
- File Size 1.3MB
- # of Slides 2
- File Format PPTX
- Slide Ratio 16:9
- Color
Keywords
About the Product
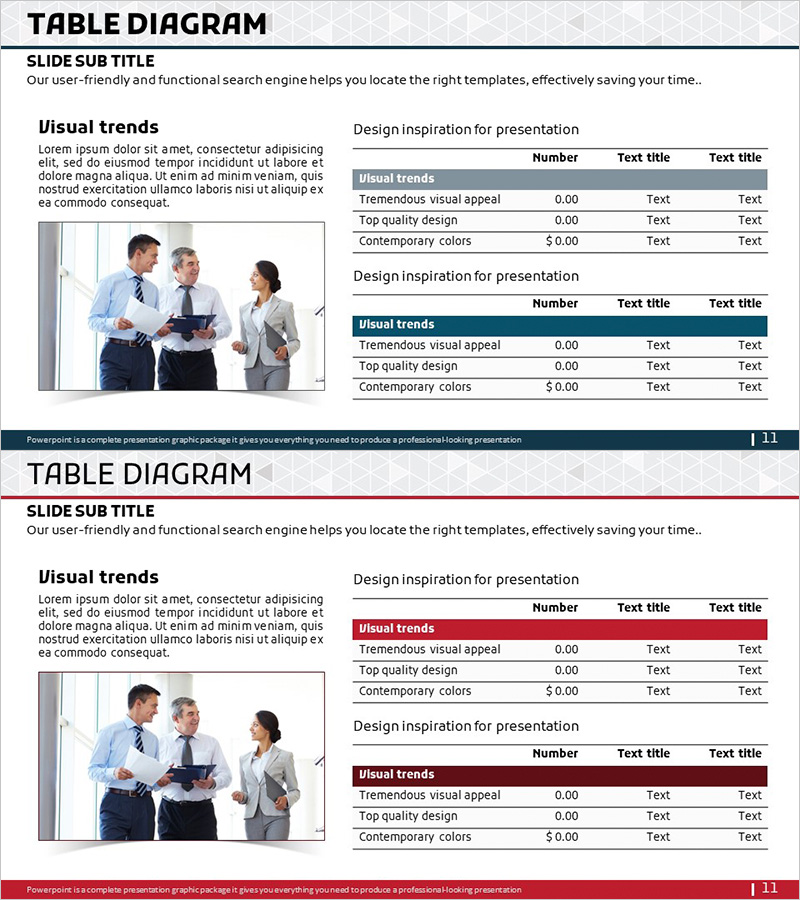
A table-formatted PowerPoint slide designed to systematically analyze and report financial performance. This presentation template features a 3-row by 5-column table structure aligned with income statement layout, enabling clear organization of key financial metrics (visual trends, quality design, contemporary colors). The navy header and light gray background create strong contrast for optimal data readability, making it immediately applicable to business presentations and financial reports. The 2-slide set allows comparison and analysis of various financial line items with professional formatting.
Usage Points
-
Main Usage
This table slide visualizes financial performance analysis and income statement data systematically. Key financial metrics (visual trends, quality design, contemporary colors) are arranged in rows and columns to facilitate comparative analysis. The navy header and light gray background color contrast enhances data readability and emphasizes professionalism.
-
How to Use
Use this template in financial reports, quarterly performance presentations, and investor briefings to display income statement data in table format. Input numerical values and text into each cell to compare financial line items and enable stakeholders to grasp trends at a glance. The 2-slide set allows side-by-side comparison of financial data across multiple periods.
-
Recommended For
CFOs, finance managers, executives, investor relations specialists, and accounting teams presenting financial performance. Ideal for business plans, investor pitch decks, quarterly performance reports, and financial analysis presentations where income statement data must be communicated clearly to stakeholders.
-
Slide Structure
The 2-slide set features a 3-row by 5-column table structure on each slide. The first row displays a navy header with item labels, while the remaining 2 rows contain numerical data and text fields. A text area on the left side accommodates additional financial analysis commentary, with 2 tables positioned on the right to support comparative analysis.
Related Products
-

Premium Management Presentation Table – Efficient Financial Planning
#Financial Plans and Performance #Diagram #Income Statement
-

Income Statement Table – Clearly Presenting Financial Plans and Performance
#Financial Plans and Performance #Diagram #Income Statement
-

Key Financial Indicators Table – Essential Information Visualization
#Financial Plans and Performance #Diagram #Income Statement
-

Insight Summary Table – Visualizing Financial Plans and Performance
#Financial Plans and Performance #Diagram #Income Statement
