Business Income Statement – Visualizing Financial Performance
RJ0300042_21
- Last Update 04/29/2025
- File Size 0.9MB
- # of Slides 2
- File Format PPTX
- Slide Ratio 16:9
- Color
Keywords
- #Content-Based Slides
- #Design-Based Slides
- #Financial Plans and Performance
- #Diagram
- #Income Statement
- #Key Financial Indicators
- #Table
- #Standard Table
- #16:9
- #financial income statement PowerPoint
- #income statement slide template
- #financial table PPT
- #financial performance visualization
- #financial report slides
- #business financial data presentation
About the Product
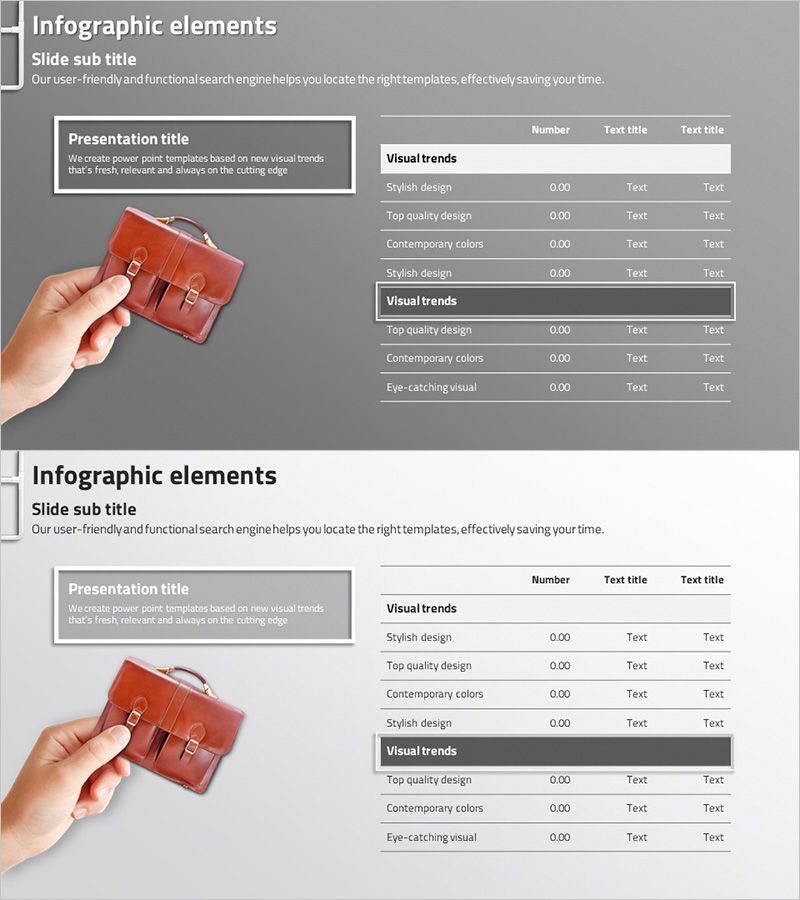
A professional financial income statement PowerPoint slide designed to visualize business performance metrics clearly. The template features a gray background with white text boxes and structured table layouts that effectively present financial data. With 2 slides, you can compare income statement line items and organize financial information systematically for investor presentations, quarterly earnings reports, and financial analysis meetings. The 16:9 widescreen PPTX format ensures compatibility across all devices and presentation platforms.
Usage Points
-
Main Usage
Present income statement components (revenue, cost of goods sold, operating income, net income) in a structured table format to communicate financial performance at a glance. Ideal for detailed financial analysis and comparative metrics across reporting periods.
-
How to Use
Use in investor relations (IR) presentations, quarterly and annual financial reports, financial analysis meetings, bank loan applications, shareholder meetings, and board presentations. Simply input your financial figures into the pre-formatted table structure.
-
Recommended For
CFOs, financial controllers, corporate executives, investor relations managers, accountants, financial consultants, business analysts, and finance professionals who need to present and analyze financial data.
-
Slide Structure
2-slide template with Slide 1 featuring a title text box and multi-row income statement table for entering financial line items and figures. Slide 2 provides an additional table or comparative analysis layout for visual emphasis and detailed financial breakdown.
Related Products
-

Key Financial Indicators Table – Clear Profit Analysis
#Financial Plans and Performance #Diagram #Income Statement
-

Premium Management Presentation Table – Efficient Financial Planning
#Financial Plans and Performance #Diagram #Income Statement
-

Key Financial Indicators Table – Trust and Professionalism
#Financial Plans and Performance #Diagram #Income Statement
-

Insight Summary Table – Visualizing Financial Plans and Performance
#Financial Plans and Performance #Diagram #Income Statement
