Blue Red Table – Perfect Combination for Business Management and Financial Planning
RB0800003_7
- Last Update 03/17/2025
- File Size 0.1MB
- # of Slides 2
- File Format PPTX
- Slide Ratio 4:3
- Color
Keywords
- #Content-Based Slides
- #Design-Based Slides
- #Business Management
- #Financial Plans and Performance
- #Diagram
- #Project Organization and Roles and Responsibilities
- #Key Financial Indicators
- #Table
- #Standard Table
- #4:3
- #data table PowerPoint slide
- #financial table template
- #business management table
- #4-column table slide
- #spreadsheet presentation template
About the Product
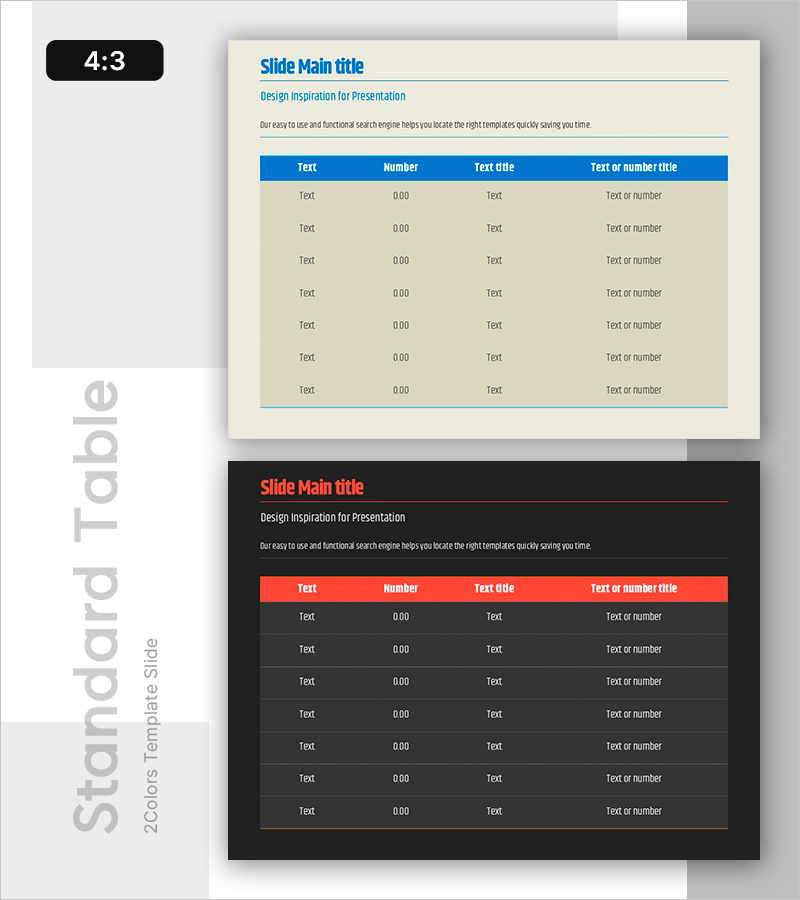
A 4-column data table PowerPoint slide optimized for business management and financial planning presentations. The two-tone color scheme combines a blue header with red accent lines to clearly establish information hierarchy. The 7-row input area accommodates text and numerical data flexibly, delivered as a 2-slide set in 4:3 aspect ratio. This presentation template is ready to use for organizing financial status, business performance, budget comparisons, departmental results, and other data-driven content.
Usage Points
-
Main Usage
Visualize and compare quantitative data such as financial status, business performance, budget comparisons, and departmental results in table format. The blue header conveys trust and professionalism, while red accent lines highlight critical figures.
-
How to Use
The 2-slide set is ready for immediate editing. Simply input your actual data into each row's text and number fields. The header row is pre-labeled (Text, Number, Text title, Text or number title) for quick customization. Colors and row heights can be adjusted as needed.
-
Recommended For
Finance teams, executives, business managers, and marketing professionals presenting quarterly reports, budget updates, departmental performance comparisons, and strategic analyses. Ideal for key data sections in business plans, reports, and proposals to enhance credibility.
-
Slide Structure
A table with 4 columns (Text, Number, Text title, Text or number title) and 7 data rows. The header features a blue background with white text, while data rows use a beige background with black text. The right border includes a red accent line for visual emphasis.
Related Products
-

Income Statement Table for Visualizing Financial Performance - Insights Navigator
#Financial Plans and Performance #Diagram #Income Statement
-

Logistics Factor Comparison Table – Intuitive Data Analysis
#Financial Plans and Performance #Diagram #Sales and Revenue
-

Key Financial Indicators Table – Essential Information Visualization
#Financial Plans and Performance #Diagram #Income Statement
-

Income Statement Table for Financial Visualization – Distinct Data Analysis
#Financial Plans and Performance #Diagram #Income Statement
