Business Plan Presentation Template - Radial Diagram & Table
RJ0200027_29
- Last Update 04/05/2025
- File Size 1.5MB
- # of Slides 2
- File Format PPTX
- Slide Ratio 16:9
- Color
Keywords
- #Content-Based Slides
- #Design-Based Slides
- #Market and Competitor Analysis
- #Financial Plans and Performance
- #Diagram
- #Graph
- #Market Analysis
- #Key Financial Indicators
- #Table
- #Other
- #Standard Table
- #Radar Chart Spider Chart
- #16:9
- #radial diagram PowerPoint
- #5-axis chart template
- #business analysis slide
- #comparison diagram
- #radar chart presentation
About the Product
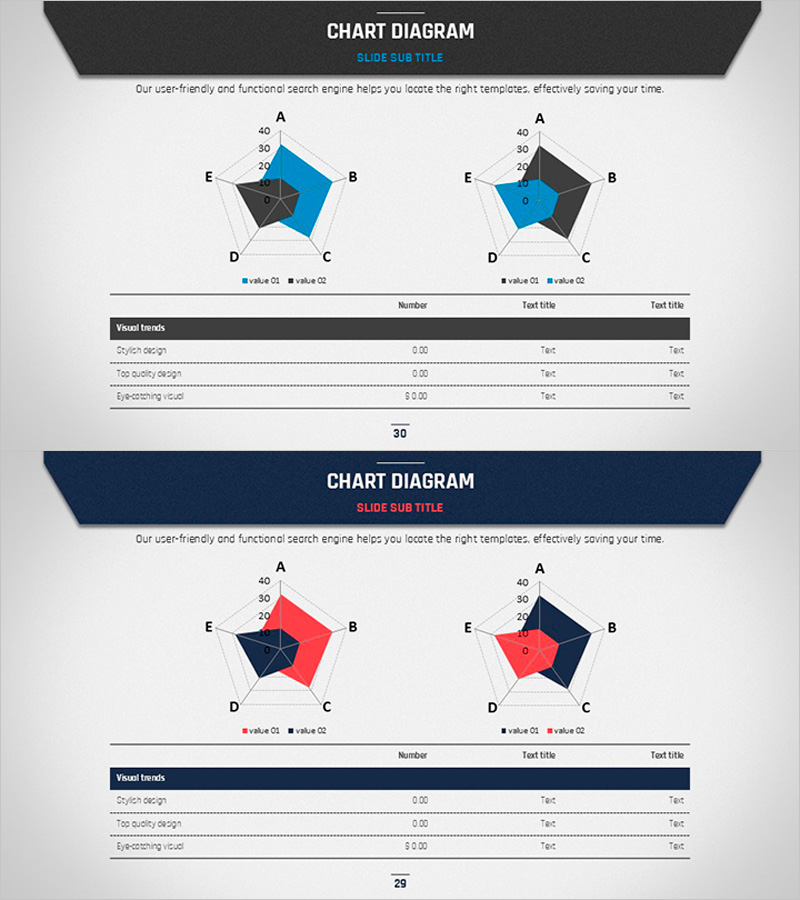
A comprehensive radial diagram PowerPoint slide set featuring five axes for multi-dimensional business analysis. This presentation template visualizes key business plan elements—marketing, finance, operations, technology, and market positioning—in a single comparative view. The design employs a dual-color scheme (blue and red) to represent two scenarios simultaneously, with clear numerical scales (0-40) on each axis. The accompanying data table slide complements the visual representation with detailed metrics, enhancing presentation credibility. This 16:9 widescreen, 2-slide PPTX template is fully editable and ready for immediate use in strategic presentations.
Usage Points
-
Main Usage
Designed to compare and analyze multiple business dimensions simultaneously—marketing, finance, operations, technology, and market factors. The radial structure intuitively displays strengths and weaknesses across each category, while the dual-color coding (current vs. target values) clarifies strategic direction and performance gaps.
-
How to Use
Integrate into executive presentations, business plans, and strategy briefings as the core analysis section. Replace axis values with actual data, populate the data table with detailed metrics, and use the slides sequentially to guide audiences through current-state assessment, target-setting, and execution planning phases.
-
Recommended For
Ideal for executives, strategy managers, business development teams, consultants, and investor pitches. Particularly effective for new business proposals, performance reviews, competitive analysis, and organizational capability assessments. Widely used in finance, IT, manufacturing, and consulting sectors for strategic planning meetings.
-
Slide Structure
Slide 1: Two 5-axis radial diagrams (blue and red) with legend and descriptive text. Slide 2: 3×3 data table with header row (Visual trends, Number, Text title). Both slides feature balanced layout with title area, chart area, and legend area in 16:9 widescreen format.
Related Products
-

Subdivided Graphs and Tables Slide – Market Analysis and Performance Data
#Market and Competitor Analysis #Financial Plans and Performance #Diagram
-

Goal Setting & Radial Graph – Intuitive Data Visualization
#Business Introduction #Market and Competitor Analysis #Diagram
-

Company Key Financial Indicators Table Slide
#Market and Competitor Analysis #Financial Plans and Performance #Diagram
-

Business Standard Table – Clear Visualization of Financial Performance
#Financial Plans and Performance #Diagram #Sales and Revenue
