Monthly Analysis Bar Graph Chart – Ideal for Market and Competitor Analysis
RJ0400060_15
- Last Update 06/03/2025
- File Size 2.1MB
- # of Slides 2
- File Format PPTX
- Slide Ratio 16:9
- Color
Keywords
- #Content-Based Slides
- #Design-Based Slides
- #Market and Competitor Analysis
- #Graph
- #Competitor Analysis
- #Market Analysis
- #Column
- #Column Chart
- #16:9
- #monthly bar chart PowerPoint
- #horizontal bar graph template
- #monthly analysis slide
- #market analysis chart
- #competitor comparison PowerPoint
- #data visualization slide template
About the Product
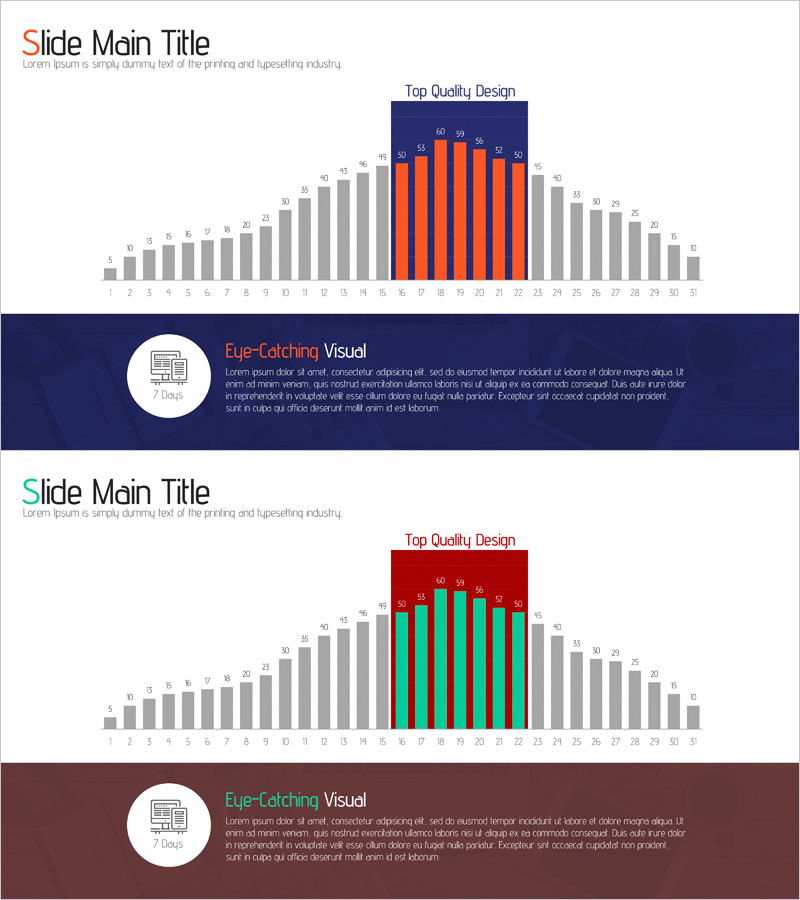
A horizontal bar chart PowerPoint slide designed to compare monthly market trends and competitor performance at a glance. This presentation slide visualizes 31 data points using gray baseline bars with orange and green accent bars, clearly marking the top-performing segment with a 'Top Quality Design' label at the top. Each bar displays numerical values for precise data reading, and the layout is optimized for 16:9 widescreen format to maximize presentation impact. This PowerPoint slide is ready to use in reports, analysis presentations, and business decks.
Usage Points
-
Main Usage
Ideal for comparing multiple data points such as monthly sales, market share, and competitor performance. The 31-item layout displays overall trends and top-performing segments simultaneously, with orange and green accent bars highlighting key data for immediate visual impact.
-
How to Use
Insert into the comparative analysis section of reports, business presentations, and executive briefings. Simply replace existing values with your data by adjusting bar heights and label numbers. Customize accent colors to emphasize different data segments as needed.
-
Recommended For
Marketing teams analyzing monthly campaign performance, sales teams reporting regional or product-based sales figures, executives reviewing market trends and competitive benchmarking, and consulting firms preparing client market analysis reports.
-
Slide Structure
Two-slide set. First slide features navy background with top label, 31 horizontal bars (gray baseline with 5 orange and 5 green accents), and numerical labels above each bar. Second slide uses the same structure with reversed accent colors (orange to green, green to navy) for flexible data representation options.
Related Products
-

Pie & Bar Analysis Graphs – Optimized for Market and Competitor Analysis
#Market and Competitor Analysis #Graph #Competitor Analysis
-

Vertical Bar Graph for Market and Competitor Analysis – Professional Data Visuals
#Market and Competitor Analysis #Graph #Competitor Analysis
-

Spade Shape Graph – Market and Competitor Analysis
#Market and Competitor Analysis #Graph #Competitor Analysis
-

Competitor and Market Analysis Green Navy Slide
#Market and Competitor Analysis #Graph #Competitor Analysis
