Science Experiment Core Goals Diagram – Strategic Business Design
RJ0400025_17
- Last Update 05/24/2025
- File Size 6.9MB
- # of Slides 2
- File Format PPTX
- Slide Ratio 16:9
- Color
Keywords
- #Content-Based Slides
- #Design-Based Slides
- #Business Introduction
- #Business Vision and Strategy
- #Diagram
- #Business Overview
- #Core Competencies
- #Cluster
- #Chain Diagram
- #16:9
- #circular diagram PowerPoint
- #3-node cycle diagram slide
- #central hub diagram template
- #strategic flow presentation
- #circular process PowerPoint slide
About the Product
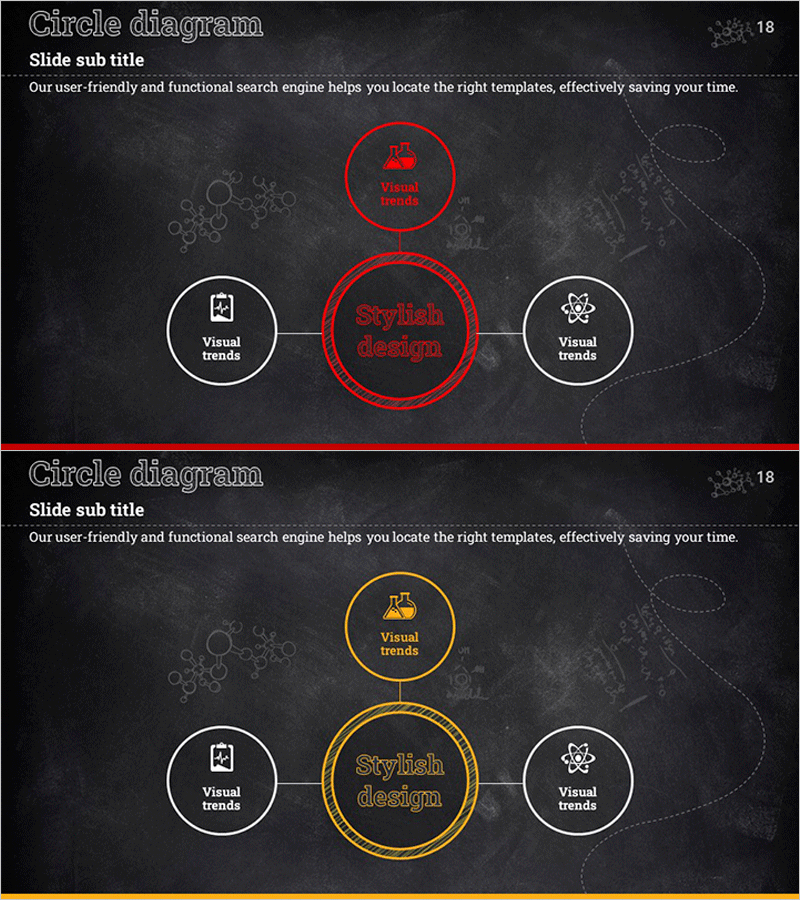
A PowerPoint slide featuring a central hub connected to three surrounding nodes in a circular flow structure. Set against a dark chalkboard background, this presentation template offers two color versions: red and orange accents. Each node includes an icon placeholder and text area for customization. Ideal for visualizing three-step cyclical relationships such as business strategy, core competencies, or process flows. The 2-slide deck in 16:9 format is fully editable and ready for corporate presentations, strategic planning sessions, and educational materials.
Usage Points
-
Main Usage
Clearly visualizes the relationship between a central strategic concept and three interconnected elements in a cyclical pattern. The structure radiates from a core idea to three surrounding nodes, making it effective for representing mutually reinforcing processes, organizational capabilities, or strategic pillars.
-
How to Use
Use in business strategy presentations to show how a core objective connects to three execution strategies, or present organizational competencies across three key dimensions. In educational contexts, illustrate learning objectives and three learning domains; in marketing decks, represent brand values and three core messaging pillars in a circular relationship.
-
Recommended For
Recommended for executives and strategy professionals presenting business direction, team leaders organizing core competencies and action items, and educators structuring learning objectives and pathways. Suitable for consulting reports, strategic planning meetings, and organizational development program presentations.
-
Slide Structure
Two-slide set with identical layouts in red and orange color schemes. Each slide contains a large central circular node (for core concept input) and three smaller circular nodes positioned left, right, and top (for supporting elements). Connecting lines and directional arrows from the center to each node emphasize the cyclical flow and relationships.
Related Products
-

Detailed Plan Diffusion Diagram – Business Strategy and Direction
#Business Introduction #Business Vision and Strategy #Diagram
-

Business Overview and Area Diagram – Blue and Orange
#Business Introduction #Business Vision and Strategy #Diagram
-

Core Competency Detailed Explanation Slide – Cluster Diagram Use
#Product/Service Introduction #Business Vision and Strategy #Diagram
-

Service Overview and Goals Green Navy Presentation Template
#Business Introduction #Business Vision and Strategy #Diagram
