Green Red Year Bundled Graph
RJ0300028_32
- Last Update 04/25/2025
- File Size 2.1MB
- # of Slides 2
- File Format PPTX
- Slide Ratio 16:9
- Color
Keywords
- #Content-Based Slides
- #Design-Based Slides
- #Business Strategy
- #Market and Competitor Analysis
- #Graph
- #Achievements
- #Industry Trends
- #Horizontal Bar
- #Grouped Horizontal Bar
- #16:9
- #grouped bar chart PowerPoint
- #year-over-year comparison slide
- #3-series data visualization
- #bar graph template download
- #business presentation slides
About the Product
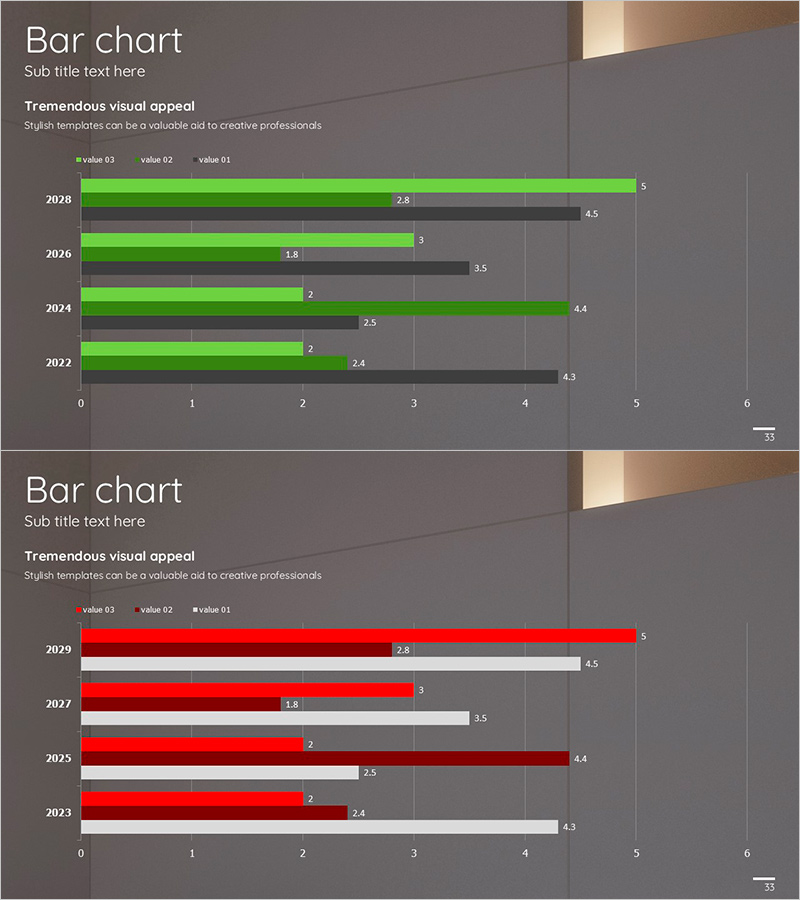
A grouped bar chart PowerPoint slide designed to compare multi-series data across years or periods. The green and red color scheme creates strong visual contrast, making it ideal for presenting performance metrics, market trends, and business strategy outcomes. Two slides are provided with identical chart structures but different color variations, allowing flexible use across multiple sections of your presentation. Delivered in 16:9 widescreen PPTX format for immediate editing and customization.
Usage Points
-
Main Usage
Display multi-series quantitative data across time periods in a single, easy-to-read format. The grouped bar structure allows viewers to compare both within-year differences and year-over-year trends simultaneously, making complex data relationships immediately apparent.
-
How to Use
Incorporate into business performance reports, market analysis presentations, financial reviews, and quarterly earnings calls. Assign semantic meaning to color groups—green for positive indicators or actual results, red for targets, comparisons, or alternative scenarios.
-
Recommended For
Executive briefings, investor presentations, annual business reviews, departmental performance comparisons, and strategic planning sessions. Particularly effective for displaying revenue trends, market share evolution, or KPI tracking across multiple fiscal periods.
-
Slide Structure
Each slide features a grouped bar chart with horizontal axis (0–6 range) and vertical axis (years 2022–2028). Three data series (value 01, 02, 03) are grouped by year, with numeric values displayed at bar endpoints. Both slides maintain identical structure with color variations for design flexibility.
Related Products
-

Analysis of Comparative Graphs by Year – Clear Visualization of Market Trends
#Business Strategy #Market and Competitor Analysis #Graph
-

100% Stacked Column Chart Slide – Performance and Market Trends
#Business Strategy #Market and Competitor Analysis #Graph
-

Annual Momentum Record – Visualization of Achievements
#Business Strategy #Market and Competitor Analysis #Graph
-

Energy Saving Performance by Year – Performance and Market Trends
#Business Strategy #Market and Competitor Analysis #Achievements
