Analysis of Comparative Graphs by Year – Clear Visualization of Market Trends
RB0100025_4
- Last Update 03/03/2025
- File Size 0.8MB
- # of Slides 2
- File Format PPTX
- Slide Ratio 4:3
- Color
Keywords
- #Content-Based Slides
- #Design-Based Slides
- #Business Strategy
- #Market and Competitor Analysis
- #Graph
- #Achievements
- #Industry Trends
- #Horizontal Bar
- #Grouped Horizontal Bar
- #4:3
- #horizontal bar chart PowerPoint
- #year-over-year comparison slide
- #market trend presentation
- #bar graph template
- #data visualization PowerPoint slide
About the Product
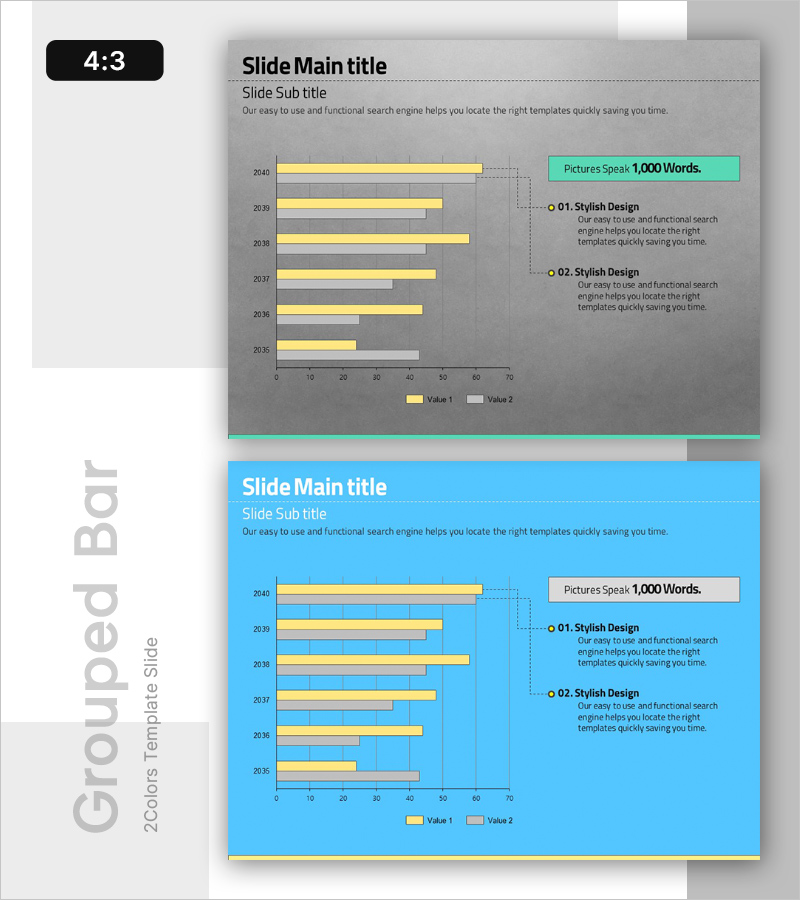
A horizontal bar chart PowerPoint slide that clearly visualizes year-over-year market trends and performance metrics. This template displays data from 2035 to 2040 across 6 years with 2 data series (Value 1 and Value 2) for comparative analysis, making it ideal for performance reports, business strategy presentations, and market analysis briefings. The dual-tone color scheme of yellow and gray distinguishes primary metrics from supporting information, while the right-side annotation area highlights 2 key insights. Provided in 4:3 aspect ratio PPTX format with fully editable elements that instantly reflect data changes.
Usage Points
-
Main Usage
Visualizes year-over-year performance trends, market dynamics, and business metrics using a horizontal bar chart format to convey numerical changes intuitively to audiences. The 2-series comparison effectively supports comparative analysis scenarios such as year-over-year growth, target vs. actual results, or product line comparisons.
-
How to Use
Input year labels and numerical values in the left graph area; bar lengths adjust automatically. Add key insights to the right-side annotation boxes (01 and 02) to strengthen data interpretation. Colors, fonts, and legend can be customized to match corporate branding guidelines.
-
Recommended For
Finance, marketing, and strategy professionals presenting quarterly or annual performance reports; market analysis sections in business plans; business metrics explanations in investor pitch decks; executive briefing materials and board presentations.
-
Slide Structure
Left side: horizontal bar chart with 6 years × 2 data series (12 bars total); top right: emphasis box with '1,000 Words' callout; bottom right: annotation area with 2 key points (01 and 02). Full 4:3 aspect ratio layout optimized for conference rooms and auditorium projectors.
Related Products
-

Green Red Year Bundled Graph
#Business Strategy #Market and Competitor Analysis #Graph
-

Day and Night Phase Cumulative Progress – Data Visualization for Business Success
#Business Strategy #Market and Competitor Analysis #Graph
-

Market Trends and Analysis Charts – Delivering Business Insights
#Business Strategy #Market and Competitor Analysis #Graph
-

Comparison Graph of Construction Performance by Year
#Business Strategy #Market and Competitor Analysis #Graph
