Accumulated Horizontal Graphs Inside Nature – Market Trend Analysis
RJ0900028_14
- Last Update 08/24/2025
- File Size 1.2MB
- # of Slides 2
- File Format PPTX
- Slide Ratio 16:9
- Color
Keywords
- #Content-Based Slides
- #Design-Based Slides
- #Business Strategy
- #Market and Competitor Analysis
- #Graph
- #Achievements
- #Industry Trends
- #Horizontal Bar
- #Segmented Horizontal Bar
- #16:9
- #stacked horizontal bar chart PowerPoint
- #horizontal bar graph template
- #market analysis slide
- #data comparison chart
- #natural tone chart PowerPoint slide
About the Product
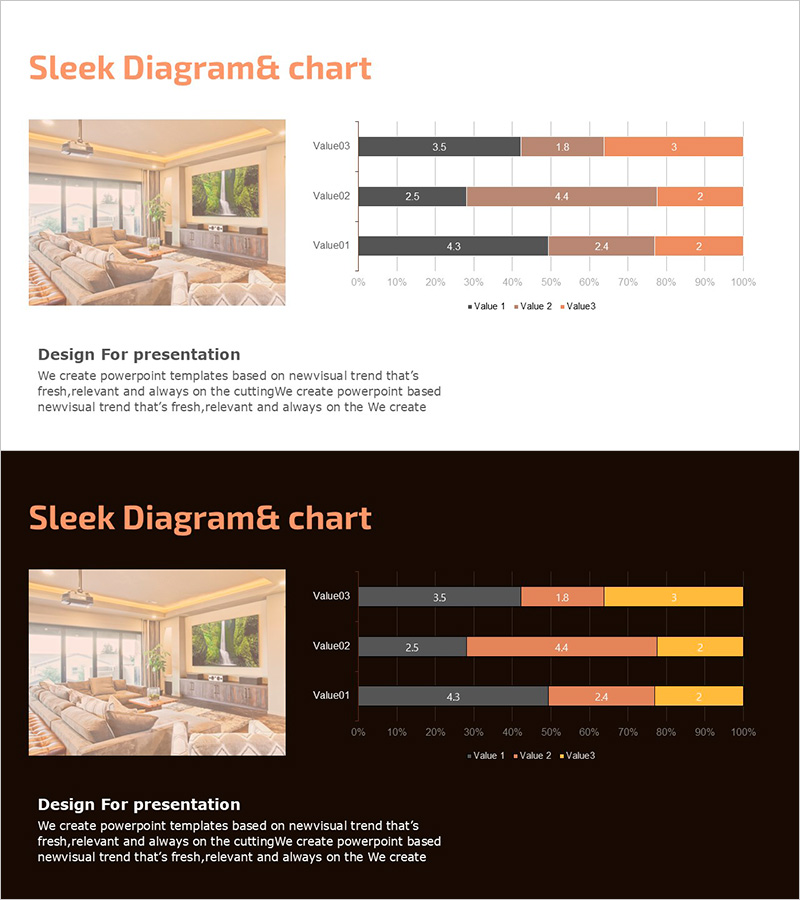
A stacked horizontal bar chart PowerPoint slide that harmonizes with natural interior design aesthetics. Composed of three warm color series—beige, brown, and orange—this slide effectively visualizes complex data such as market trends, sales progression, and growth ratios. The chart displays three values (Value 1, 2, and 3) in a 0–100% cumulative format, allowing viewers to compare both individual contributions and total composition. Paired with an interior space image, it enhances presentation credibility. The 2-slide set includes both light and dark background versions, enabling you to select the appropriate design for your presentation environment.
Usage Points
-
Main Usage
Compares three or more data series in cumulative form to simultaneously display overall composition ratios and individual item contributions. Ideal for visualizing complex numerical data such as market share, revenue composition, budget allocation, and performance indicators with clarity and impact.
-
How to Use
Enter category names in each row (Value01, 02, 03) and input numerical values for the three series within the 0–100% range; the stacked bar automatically generates. Use the light background slide for daytime presentations and printed materials; use the dark background for evening projections and online presentations.
-
Recommended For
Business strategy presentations, market analysis reports, sales performance reviews, budget planning meetings, marketing planning presentations, quarterly performance assessments, and other data-driven decision-making scenarios requiring clear numerical comparison.
-
Slide Structure
2-slide set: light background (beige tone) + dark background (black tone). Each slide features three rows of stacked horizontal bar charts with legend (Value 1, 2, 3) and an interior design image on the left side for visual balance and professional appearance.
Related Products
-

Comparison Graph of Business Trends by Year – Performance and Market Trends
#Business Strategy #Market and Competitor Analysis #Graph
-

100% Stacked Column Chart Slide – Performance and Market Trends
#Business Strategy #Market and Competitor Analysis #Graph
-

Sales Trends Over the Past Four Years - Graph for Market Analysis and Achievements
#Business Strategy #Market and Competitor Analysis #Graph
-

Graph of Change in Number of Occurrences – Market Trends and Performance
#Business Strategy #Market and Competitor Analysis #Graph
