Day and Night Phase Cumulative Progress – Data Visualization for Business Success
RB0500016_5
- Last Update 03/13/2025
- File Size 1MB
- # of Slides 2
- File Format PPTX
- Slide Ratio 4:3
- Color
Keywords
- #Content-Based Slides
- #Design-Based Slides
- #Business Strategy
- #Market and Competitor Analysis
- #Graph
- #Other
- #Achievements
- #Industry Trends
- #4:3
- #cumulative progress chart PowerPoint slide
- #stacked area chart presentation
- #day night phase data visualization
- #business progress tracking slide
- #how to create cumulative data chart in PowerPoint
About the Product
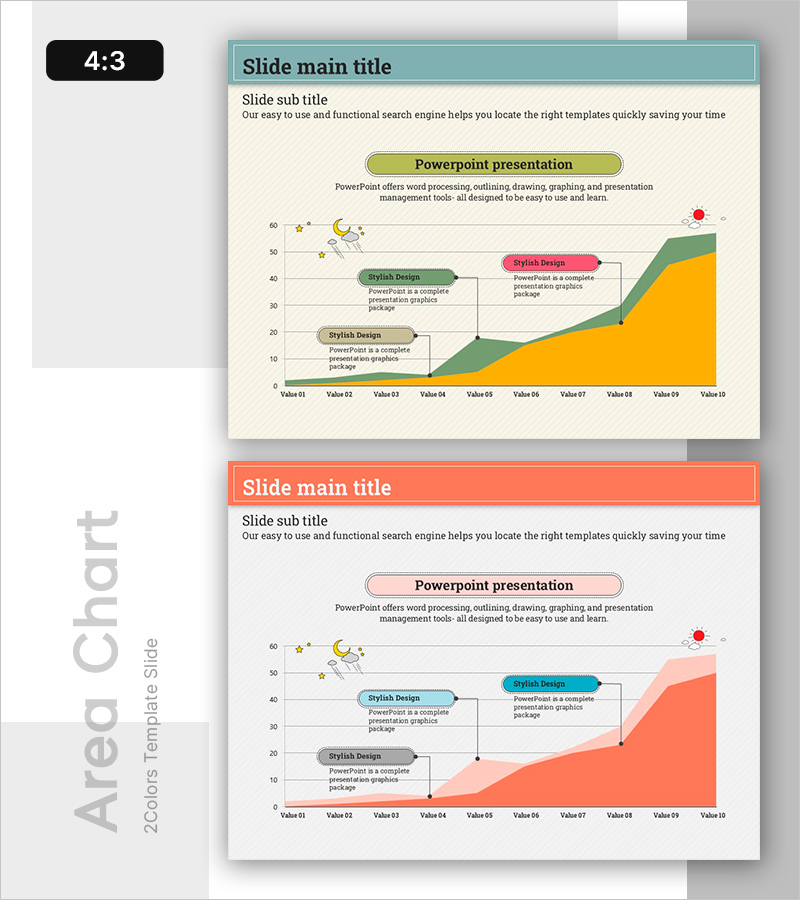
A PowerPoint slide visualizing day and night phase cumulative progress using a stacked area chart. The 2-slide set features three-layer cumulative area visualization in teal, orange, and green with annotation boxes for clear stage-by-stage progress representation. Ideal for business strategy presentations, performance reports, and market trend analysis where data-driven decision-making is essential. The slide layout separates text input areas from the chart, enabling easy customization to match your presentation narrative and specific project metrics.
Usage Points
-
Main Usage
Visualize multi-stage cumulative data to communicate project progress at a glance. The stacked area chart structure clearly shows each phase's contribution to overall progress and effectively conveys cumulative trends over time, enabling stakeholders to understand project trajectory and performance metrics instantly.
-
How to Use
Deploy in business strategy presentations, quarterly or monthly performance reports, and project status updates. Use the chart legend and annotation boxes to explain each stage's significance, input specific metrics and insights in text areas to enhance audience comprehension, and leverage color differentiation to distinguish process phases intuitively.
-
Recommended For
Project managers, business leaders, and performance reporting specialists presenting progress data to executive teams. Effective for manufacturing and construction project tracking, IT project management, marketing campaign progress monitoring, and organizational performance sharing meetings.
-
Slide Structure
The slide comprises a title and subtitle area, a central three-layer stacked area chart, and three annotation boxes on the right. The chart x-axis displays Value 01 through Value 10 to represent time or sequential stages, with each annotation box providing editable text space for stage-specific explanations and insights.
Related Products
-

Real Estate Market Trends Chart – Data Analysis and Performance
#Business Strategy #Market and Competitor Analysis #Graph
-

Illustration Glass Bottle Segmentation Graph – Market Trend Analysis
#Market and Competitor Analysis #Graph #Other
-

Stacked Bar Graph for Growing Market Trends – Business Strategy
#Business Strategy #Market and Competitor Analysis #Graph
-

Core KPIs for Enhancing Presentation Performance – Measuring Work Outcomes
#Business Strategy #Diagram #Graph
