System Efficiency Growth – Market Analysis and Business Strategy
RB0800055_6
- Last Update 03/26/2025
- File Size 0.3MB
- # of Slides 2
- File Format PPTX
- Slide Ratio 4:3
- Color
Keywords
About the Product
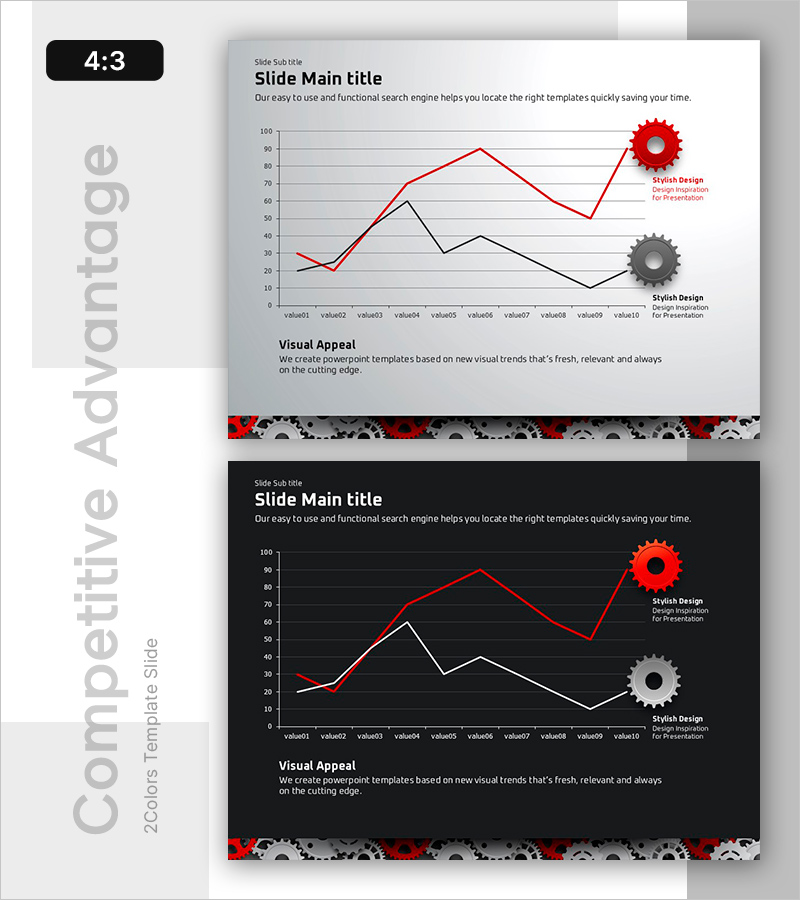
A dual-series line chart PowerPoint slide that visualizes system efficiency and market growth trends across 10 data points. Red and black lines track comparative performance metrics with gear icons emphasizing design elements. Presented in 4:3 aspect ratio with 2 slides featuring both light and dark background versions for flexible presentation environments. Ready-to-use for business strategy, competitive analysis, and performance reporting presentations.
Usage Points
-
Main Usage
Effectively compare two performance indicators over time, making it ideal for presenting business metrics, market trends, competitive positioning, and efficiency improvements with clear visual impact.
-
How to Use
Replace data points with your actual figures and customize gear icons and text labels to match your presentation context. Choose between light or dark background versions depending on your presentation environment and display setup.
-
Recommended For
Executives, marketing teams, analysts, and project managers presenting quarterly performance, market share, customer satisfaction, or cost efficiency metrics. Suitable for business plans, investor pitches, performance reports, and strategic planning meetings.
-
Slide Structure
2-slide set in 4:3 format. Each slide features a dual-series line chart (red and black lines) with 10 data points, two gear icons (red and gray) on the left, and text label area on the right. One light-background version and one dark-background version included.
Related Products
-

Annual Momentum Record – Visualization of Achievements
#Business Strategy #Market and Competitor Analysis #Graph
-

Market Overview and Growth Trend – Strategic Data Analysis
#Business Strategy #Market and Competitor Analysis #Diagram
-

Annual Content Trend Evolution – Market Trend Analysis
#Market and Competitor Analysis #Diagram #Graph
-

Market Trends and Competitor Analysis Chart – Emphasizing Future Outlook
#Market and Competitor Analysis #Graph #Future Outlook
