Two Analytical Graphs for Market and Competitor Analysis
RJ0300028_26
- Last Update 04/25/2025
- File Size 2.3MB
- # of Slides 2
- File Format PPTX
- Slide Ratio 16:9
- Color
Keywords
About the Product
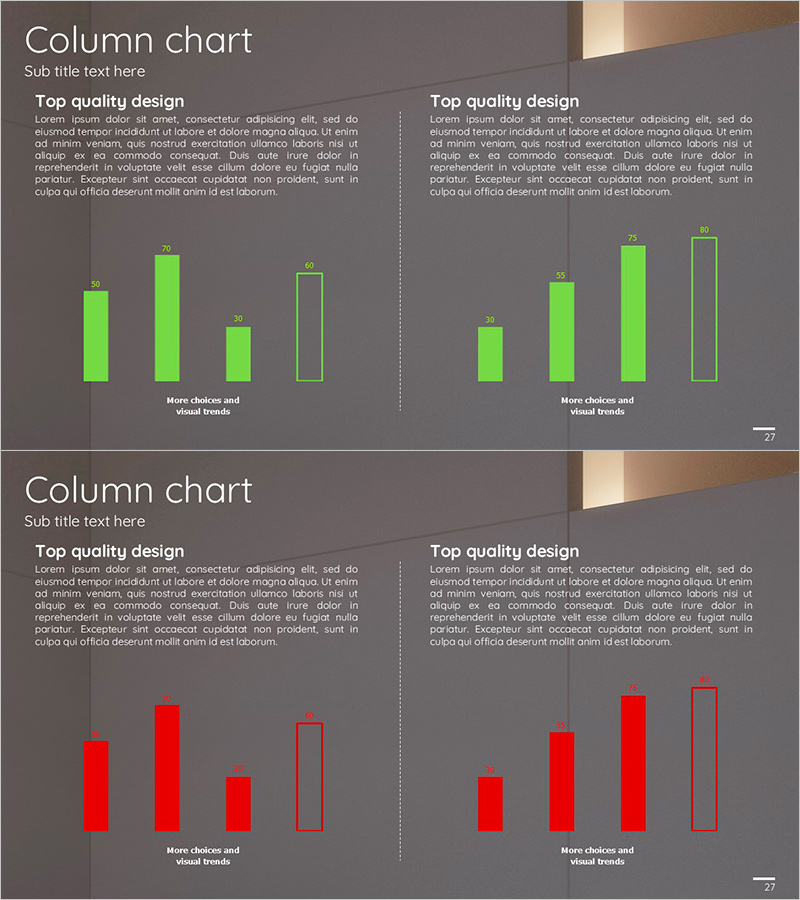
This free PowerPoint slide features two vertical column charts designed for market and competitor analysis. Available in lime green and red color options to match your presentation theme and tone. Each chart displays four data points in a symmetrical left-right layout, making it ideal for comparing competitor performance or analyzing market data. Simply replace the text and numbers to create a professional analysis slide ready for business plans, proposals, reports, and investor presentations. Download for free and customize in PowerPoint to fit your needs.
Usage Points
-
Main Usage
Visualize and compare numerical data across two groups, such as market performance, competitor metrics, or quarterly results. The symmetrical layout allows you to present two scenarios or competitive situations side by side.
-
How to Use
Replace the chart values (50, 70, 30, 60, etc.) with your own data and edit the title and description text. Choose between lime green or red color schemes to match your presentation style and audience.
-
Recommended For
Market analysis sections in business plans and proposals, competitor analysis pages in investor pitch decks, competitive comparison slides in marketing plans, and quarterly or annual performance comparison reports.
-
Slide Structure
Single slide with two vertical column charts arranged symmetrically. Each chart displays four data points with values labeled above. Title and descriptive text areas at the top provide context for the data visualization.
Related Products
-

Market Analysis Graph – Harmony of Pink and Bluegreen
#Free Graphs
-

Comparative Analysis Bar Graph – Market and Competitor Analysis
#Free Graphs
-

Tree Yellow Purple Area Chart – Innovation in Data Visualization
#Free Graphs
-

Vertical Bar Chart Visualizing Candidate Values – Trends and Choices
#Free Graphs
