Analyzing Market Share with 3 Donut Charts and Tables
RJ0300028_19
- Last Update 04/25/2025
- File Size 2.3MB
- # of Slides 2
- File Format PPTX
- Slide Ratio 16:9
- Color
Keywords
- #Content-Based Slides
- #Design-Based Slides
- #Market and Competitor Analysis
- #Diagram
- #Graph
- #Market Share
- #Market Analysis
- #Table
- #Circles
- #Standard Table
- #Doughnut Chart
- #16:9
- #donut chart PowerPoint
- #pie chart slide template
- #ratio comparison presentation
- #market share visualization
- #donut graph download
- #data visualization slides
About the Product
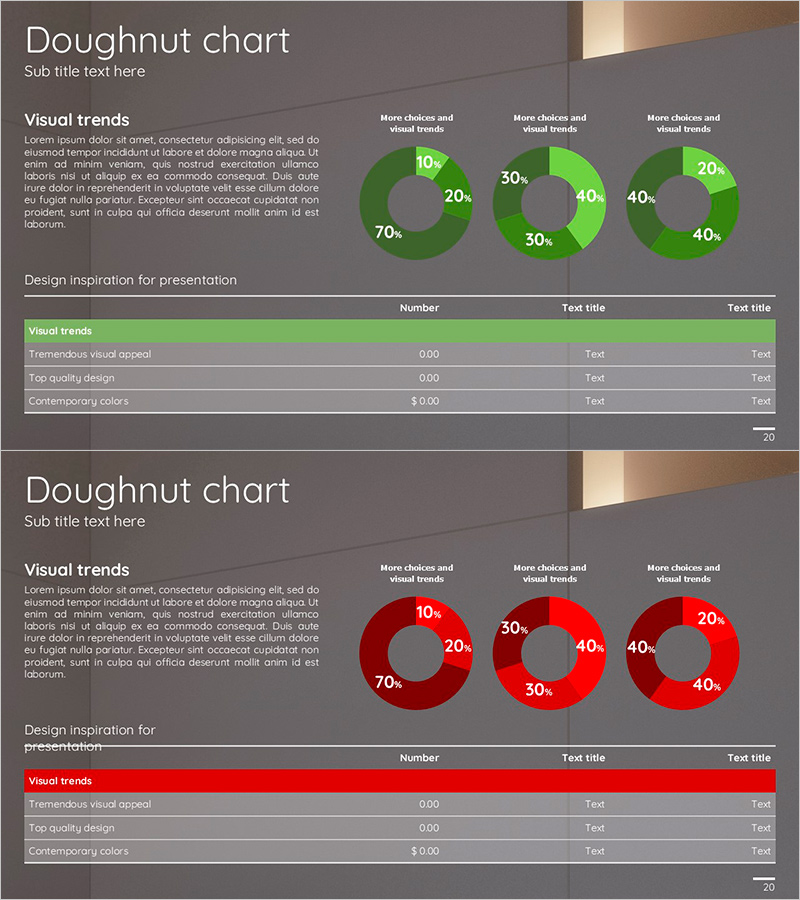
A professional PowerPoint slide featuring three donut charts designed to visualize ratio data such as market share, sales distribution, and customer composition. Each donut chart displays 4-5 segments with percentage labels, and a data table below each chart provides exact numerical values for clarity. Two color versions—green and red—are included to match your presentation theme and audience context. This 2-slide set enables immediate use for comparative analysis presentations, financial reports, and market research summaries.
Usage Points
-
Main Usage
Effectively communicate proportional data by displaying market share, revenue distribution, budget allocation, and customer segment composition. The donut format allows emphasis of key metrics in the center, while the accompanying data table provides precise numerical context for stakeholder discussions.
-
How to Use
Ideal for executive briefings, quarterly business reviews, marketing strategy presentations, and financial performance meetings. Simply replace the sample percentages and table values with your actual data. The editable chart segments and table rows adapt to your specific metrics without reformatting.
-
Recommended For
Finance professionals, business analysts, marketing managers, sales directors, management consultants, and data scientists presenting quantitative findings. Suitable for board presentations, investor updates, departmental performance reviews, and competitive analysis reports.
-
Slide Structure
Each slide contains a title section, descriptive text area, three donut charts (each with 4-5 colored segments and percentage labels), legend indicators, and a structured data table with columns for item name, numerical value, and additional metrics. Charts are fully editable with customizable colors and segment values.
Related Products
-

Mobile Development Status Analysis Graph – Market Analysis and Competitiveness
#Product/Service Introduction #Market and Competitor Analysis #Diagram
-

Purple Brown Market Share Analysis – Emphasizing Visual Appeal
#Market and Competitor Analysis #Graph #Other
-

Shareholder Status Survey Donut Graph – Optimized for Market Analysis
#Company Introduction #Market and Competitor Analysis #Diagram
-

Performance Analysis with Donut Chart and Table
#Market and Competitor Analysis #Diagram #Graph
