Interior Template Line Chart – Market Trends and Competitive Advantage
RJ0300028_15
- Last Update 04/25/2025
- File Size 2.1MB
- # of Slides 2
- File Format PPTX
- Slide Ratio 16:9
- Color
Keywords
- #Content-Based Slides
- #Design-Based Slides
- #Market and Competitor Analysis
- #Graph
- #Market Status
- #Competitive Advantage
- #Line
- #Line Chart
- #16:9
- #line chart PowerPoint
- #dual-series line graph slide
- #trend analysis presentation
- #10-year data comparison
- #market trends slide template
- #how to create line chart in PowerPoint
About the Product
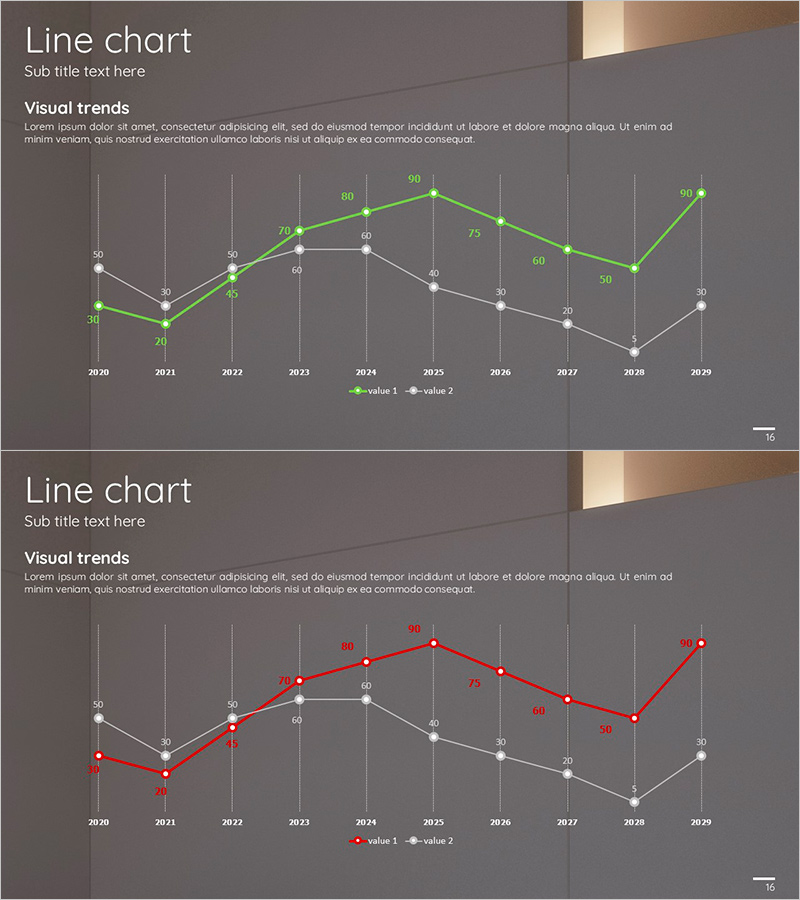
A PowerPoint line chart slide comparing two data series from 2020 to 2029 with clear visual differentiation. The design features a gray background with green and red trend lines, each marked with data point values for precise numerical reference. This presentation slide effectively communicates market trends, sales performance, or competitive metrics across a decade-long period. The dual-series format allows direct comparison between two variables, making it ideal for business reports, quarterly reviews, and strategic presentations. The 16:9 widescreen format includes 2 fully editable slides ready for immediate use.
Usage Points
-
Main Usage
Visualizes changes in two data series over time, enabling clear comparison of trends, growth rates, or performance metrics. The dual-line format helps audiences quickly identify diverging or converging patterns, making it essential for data-driven business presentations.
-
How to Use
Replace the year labels (2020–2029) and numerical values with your actual data. Modify the legend at the bottom to reflect your two comparison categories (e.g., Product A vs Product B, Current Year vs Previous Year). The color scheme can be adjusted to match your brand guidelines.
-
Recommended For
Marketing managers, sales directors, financial analysts, and business executives presenting market analysis, sales reports, competitive benchmarking, or performance reviews. Commonly used in business plans, quarterly earnings presentations, investor pitch decks, and strategic planning documents.
-
Slide Structure
Both slides feature identical layouts with a title section (Line chart / Sub title text here), descriptive text area (Visual trends), and a dual-series line graph displaying 10 data points across 10 years. Each line is color-coded with a legend positioned at the bottom for easy reference.
Related Products
-

Visualizing Use of Transportation for Overseas Travel – Market Status Analysis
#Market and Competitor Analysis #Graph #Market Status
-

Line Graph for Market Trends Visualization – Competitive Advantage Analysis
#Market and Competitor Analysis #Graph #Market Status
-

Blue Green Basic Line Chart – Market Status and Competitive Analysis
#Market and Competitor Analysis #Graph #Market Status
-

Travel Preference Survey Slide – Market Status and Competitive Advantage
#Market and Competitor Analysis #Graph #Market Status
