Work Stress Visualized with Line Chart – Analysis and Competitive Advantage
RJ0800025_27
- Last Update 08/06/2025
- File Size 1MB
- # of Slides 2
- File Format PPTX
- Slide Ratio 16:9
- Color
Keywords
- #Content-Based Slides
- #Design-Based Slides
- #Market and Competitor Analysis
- #Graph
- #Market Status
- #Competitive Advantage
- #Line
- #Line Chart
- #16:9
- #line chart PowerPoint slide
- #trend analysis PPT template
- #workplace stress chart
- #competitive advantage slide
- #how to create line chart in PowerPoint
- #graph PowerPoint template
About the Product
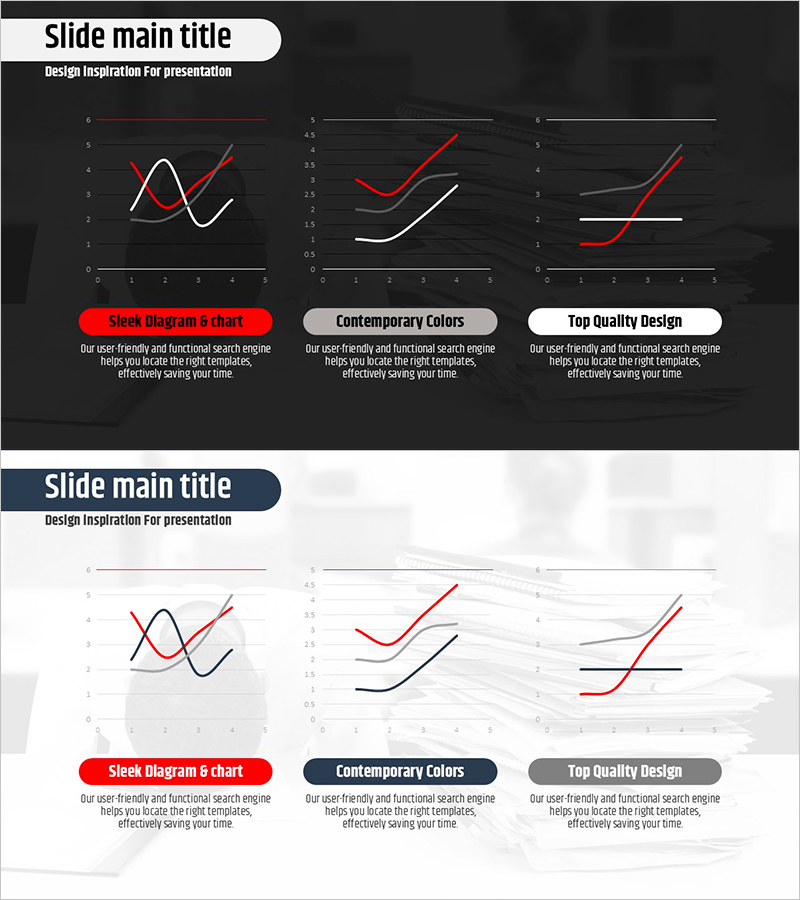
A line chart PowerPoint slide visualizing workplace stress and competitive advantage with three data series on a dark background. Red, white, and gray curves clearly display data trends across time periods. The 2-slide set includes market analysis on the first slide and competitive comparison on the second. Grid background and axis labels ensure accurate data reading. Ready-to-use presentation template for reports, analysis decks, and business presentations.
Usage Points
-
Main Usage
Visualize numerical changes over time such as workplace stress levels, market trends, and competitor performance using line graphs. Three simultaneous data series enable quick comparison of multiple metrics. Ideal for executive reports, strategy meetings, and marketing analysis presentations.
-
How to Use
Slide 1 is designed for market analysis; Slide 2 for competitive comparison. Modify data values and legends to match your organization's context. Add or remove series and adjust colors as needed. Dark background ensures excellent visibility in projector environments.
-
Recommended For
Executives, marketing teams, strategy planners, finance teams, and HR departments presenting trend analysis results. Recommended for quarterly performance reviews, market trend analysis, employee satisfaction tracking, and competitor benchmarking materials.
-
Slide Structure
2-slide set. Each slide contains a 3-series line chart with horizontal and vertical gridlines and Y-axis scale (0–6 range) for data accuracy. Text area below each chart allows for additional analysis commentary and insights.
Related Products
-

Line Graph for Camping Market Analysis – Market Trends and Competitive Advantage
#Market and Competitor Analysis #Graph #Market Status
-

Comparison of Change Curves – Market and Competitor Analysis
#Market and Competitor Analysis #Graph #Market Status
-

Travel Preference Survey Slide – Market Status and Competitive Advantage
#Market and Competitor Analysis #Graph #Market Status
-

Dynamic Line Graph – Market and Competitor Analysis
#Market and Competitor Analysis #Graph #Market Status
