Key Market Analysis Donut Chart – Market Share Visualization
RJ0300002_15
- Last Update 04/19/2025
- File Size 14.4MB
- # of Slides 2
- File Format PPTX
- Slide Ratio 16:9
- Color
Keywords
About the Product
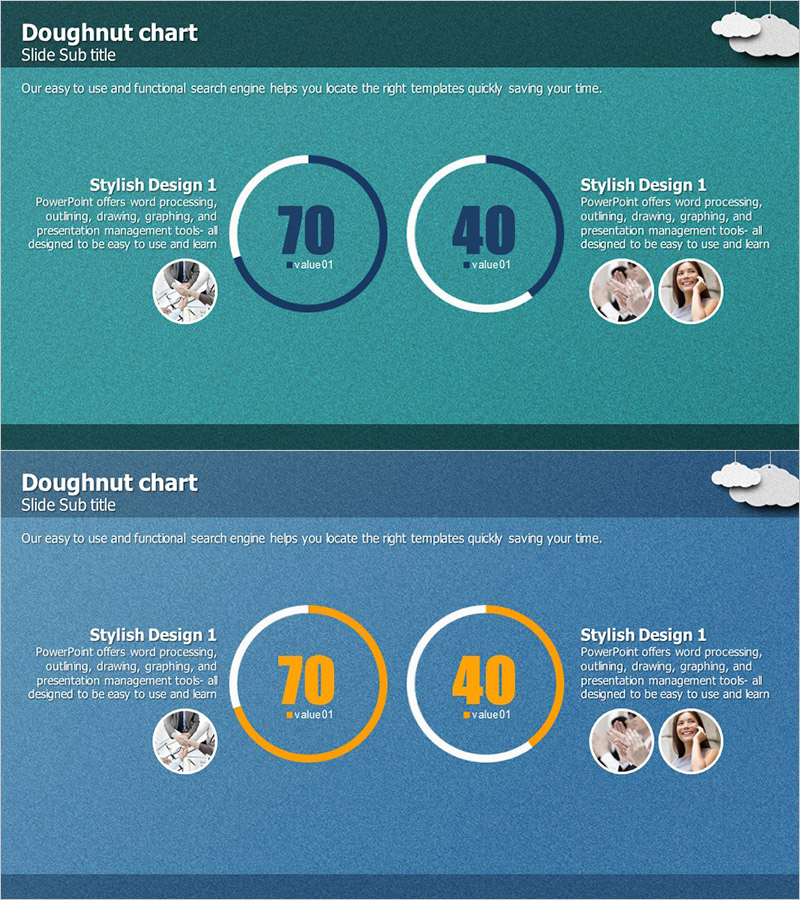
A professional donut chart PowerPoint slide designed to visualize market share and competitive analysis with two-segment data representation. The slide features a teal and orange dual-tone background with two donut graphs positioned side by side, each with a central numeric value (70, 40) prominently displayed. Profile photo areas are included for presenting stakeholder or department information. This 16:9 widescreen 2-slide template is ready for immediate use in business presentations, marketing analysis reports, and market research decks.
Usage Points
-
Main Usage
Display and compare two key metrics such as market share percentages, sales performance, or competitive positioning using donut graphs. The central numeric values emphasize critical data points, while profile areas allow you to attribute information to specific departments or team members, adding accountability to your analysis.
-
How to Use
Ideal for marketing strategy presentations, quarterly performance reports, and competitive analysis meetings. Simply replace the numeric values with your actual data and insert relevant profile photos or department logos in the designated areas. The dual-chart layout enables direct side-by-side comparison of two market segments or business metrics.
-
Recommended For
Marketing managers, sales directors, executives, management consultants, and market analysts presenting to leadership, investors, or strategic planning committees. Particularly effective when comparing two competing products, market segments, or performance metrics that require quantitative visual comparison.
-
Slide Structure
2-slide template with dual donut charts on each slide positioned left and right. Each donut features a central numeric input area with dark blue outline on the left chart and white outline on the right chart. Slide 1 uses a teal background; Slide 2 features an orange accent background. Text description areas and profile photo insertion zones are positioned adjacent to each chart for contextual information.
Related Products
-

Red Market Share Slide – Compelling Donut Chart Design
#Market and Competitor Analysis #Graph #Market Share
-

Market Share Global Map – Real-Time Data for Market Analysis
#Market and Competitor Analysis #Graph #Market Share
-

Donut Chart Slide for Dessert Menu Research – Market Analysis
#Market and Competitor Analysis #Diagram #Graph
-

Analysis of Crime Occurrence Locations – Data Visualization
#Market and Competitor Analysis #Graph #Market Share
