Doughnut Chart Slide Visualizing Market Share by Country
RJ0600094_17
- Last Update 07/16/2025
- File Size 0.9MB
- # of Slides 2
- File Format PPTX
- Slide Ratio 16:9
- Color
Keywords
About the Product
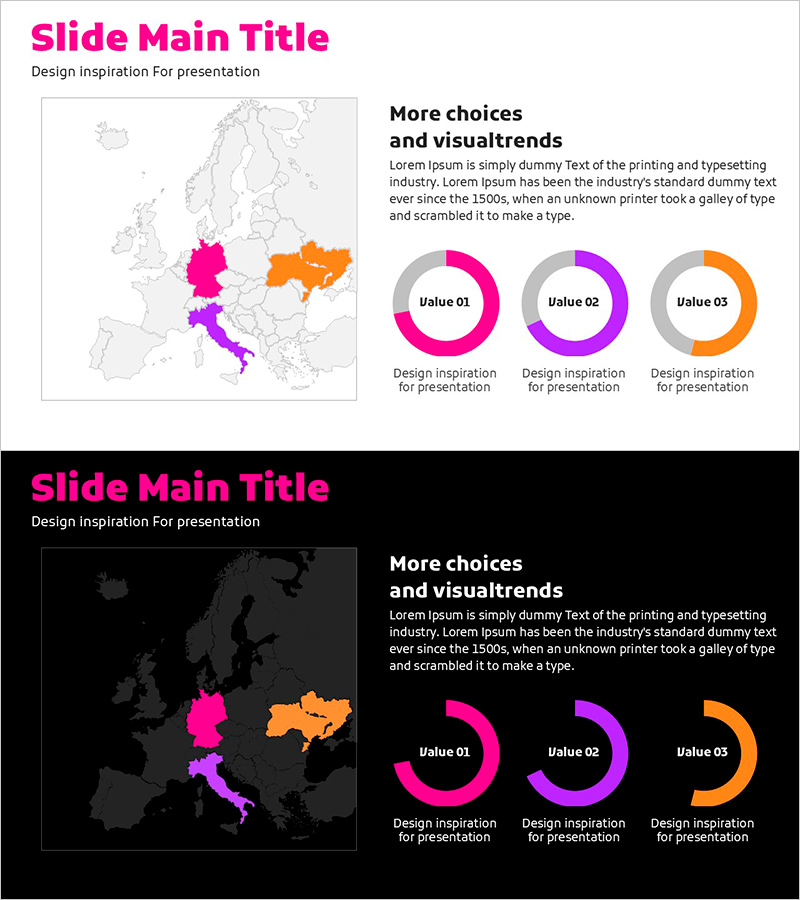
A doughnut chart PowerPoint slide that visualizes market share by country with intuitive data representation. The circular graph is divided into three segments using magenta, orange, and purple colors to distinguish each country's market penetration. Paired with a European map visualization, this slide enables clear regional data analysis for competitive benchmarking and market assessment presentations. Formatted in 16:9 aspect ratio across 2 slides, fully editable with customizable numbers, legends, and colors to adapt to various business scenarios and reporting needs.
Usage Points
-
Main Usage
Communicate market share, sales distribution, and customer penetration across countries or regions using a circular graph format. The doughnut center space allows emphasis of key metrics or strategic messages to executives, investors, and stakeholders.
-
How to Use
Insert into business plans, investment pitch decks, or market analysis reports within market overview or competitive analysis sections. Replace country names and percentages with actual data, adjust colors to match corporate branding, and the presentation becomes immediately professional-ready.
-
Recommended For
Marketing managers, executives, and sales teams presenting market penetration, sales performance, and customer distribution. Ideal for global business strategy presentations, new market entry planning, and competitive benchmarking discussions.
-
Slide Structure
Slide 1: European map with 3 countries highlighted in distinct colors. Slide 2: Doughnut chart with 3 data segments (magenta, purple, orange) representing country market share, including legend and percentage labels. Both slides delivered in 16:9 widescreen format.
Related Products
-

Donut Chart & Map Template for Social Network Visualization
#Market and Competitor Analysis #Graph #Other
-

Analyzing ABC District Occupancy with Doughnut Chart
#Market and Competitor Analysis #Graph #Other
-

Purple Brown Market Share Analysis – Emphasizing Visual Appeal
#Market and Competitor Analysis #Graph #Other
-

Simple Car Wide Presentation Map&Donut Chart – Market Share Analysis
#Market and Competitor Analysis #Graph #Other
